Solana (SOL) - Edition #3
After our last update on Solana, we discussed key resistance levels and macro projections. Now, with prices dipping to the $206 range, it’s time to reassess using the weekly and monthly timeframes. We’ll also analyze SOLETH performance and its impact on Solana, particularly in relation to Ethereum. Let’s dive into the latest technicals and the strategy moving forward.
Solana Update: Analyzing the Current Moves
We successfully timed the initial sell at $246 and re-entered at $206, as outlined in our Telegram updates. After a strong bearish rejection at the previous high, Solana has reached a key demand zone, aligning with the mid-retracement level of the current move. The weekly chart shows a candle stepping down into this demand area, following the block from the March 2024 highs.
You can view the chart here: Weekly Chart.
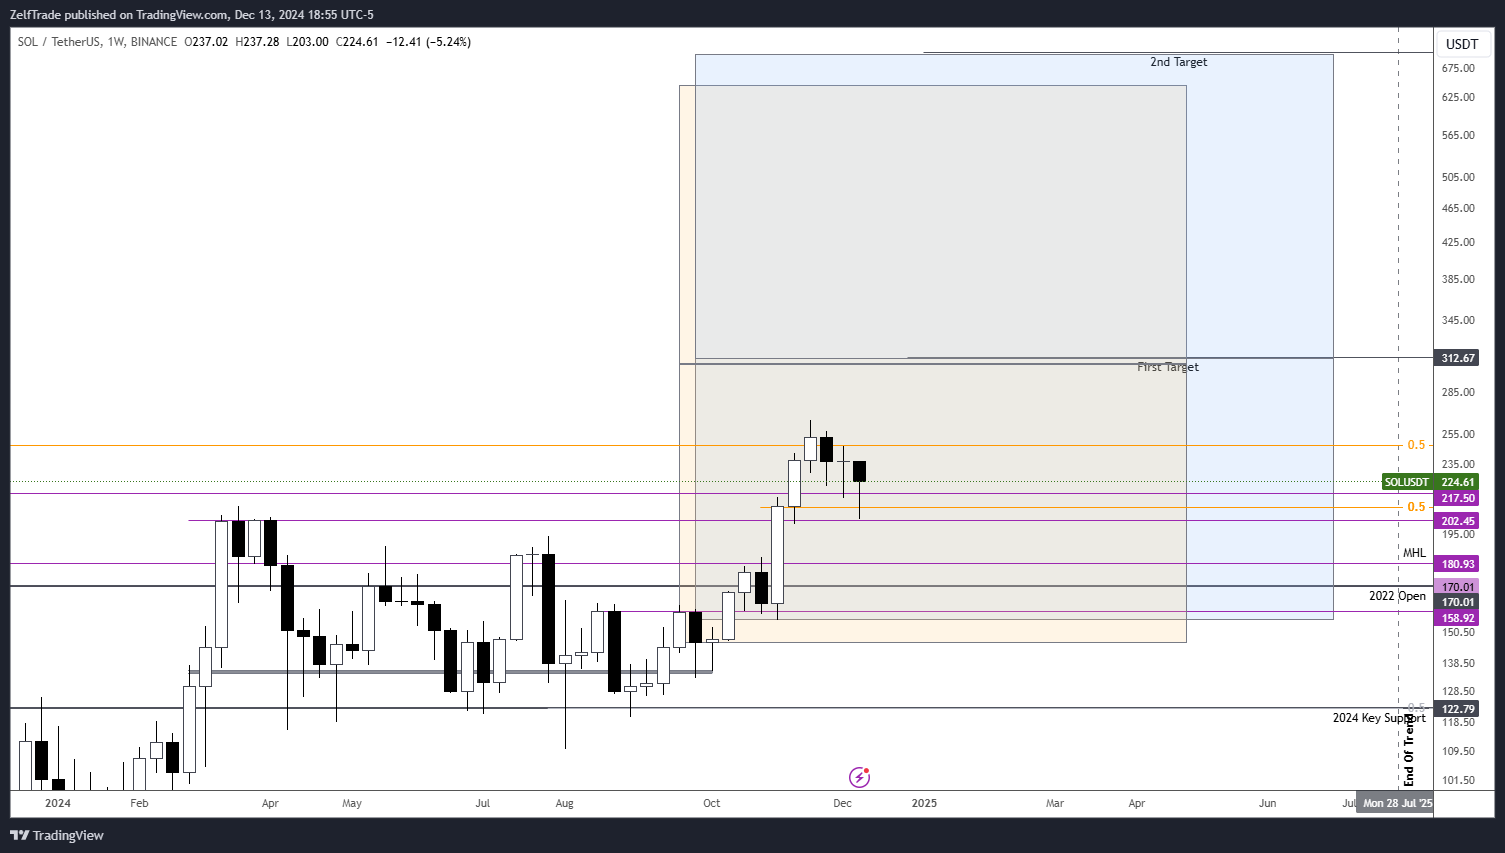
The notable technical development here is the three consecutive candles grabbing liquidity below the previous ones while closing above. This is a bullish sign, particularly since it's occurring at a strong demand level. This suggests the current support zone is valid and could lead to a potential bounce.
The Plan Moving Forward
For now, the strategy is to hold the buys at $206 and wait for a solid base to form within this range. If we reclaim the $246 level, it could signal a breakout, potentially reaching a target of $700. Although $180 might seem like an appealing entry, such a dip would imply a significant retrace in $BTC, which isn’t anticipated. However, if it happens, it would present an ideal position for a trade.
Monthly Timeframe Analysis: Retesting Key Levels
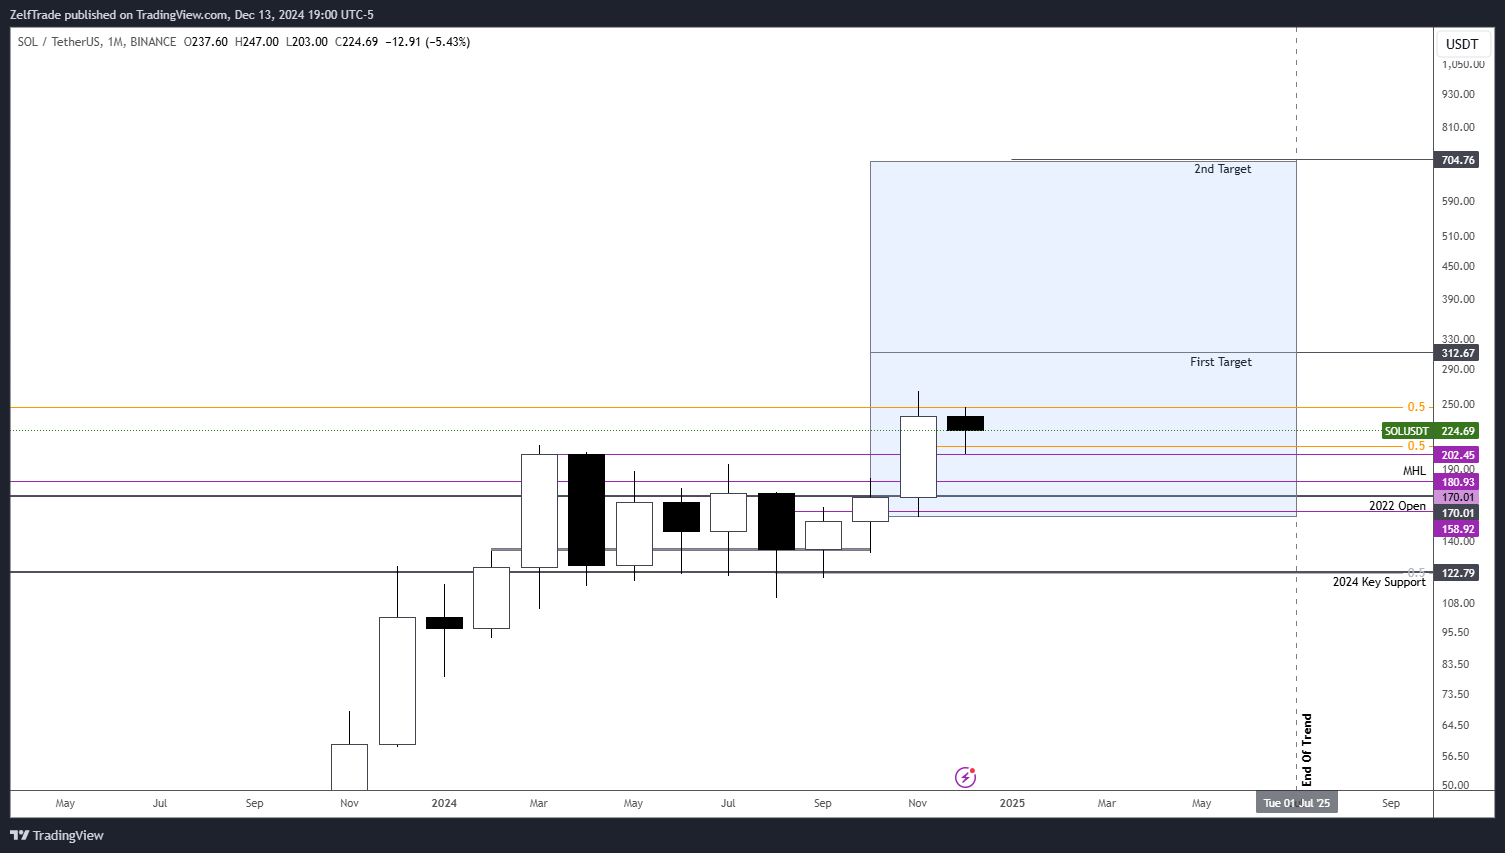
The monthly chart offers a clearer view of Solana's long-term trend. Although we didn’t close above the $246 zone as expected, we’re currently in the retrace phase for December, aligning with our original plan. The re-entry in the low $200s coincided with the second-highest monthly close historically and the mid-retracement level for November.
You can view the monthly chart here: Monthly Chart.
SOLETH Performance: A Shift in Focus
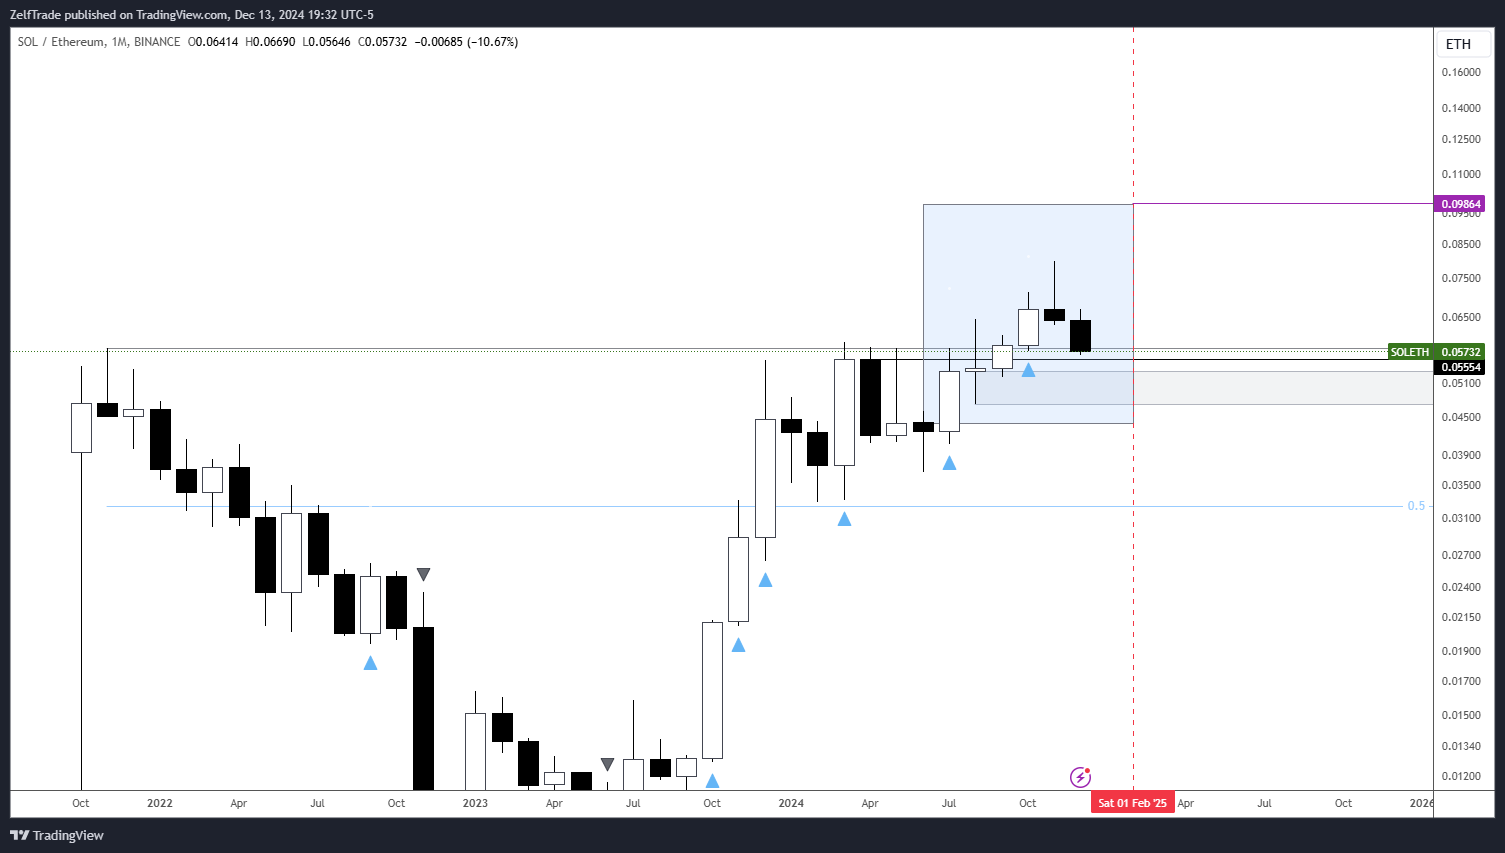
The SOLETH performance is no longer valid on the monthly timeframe. The expected trend has been invalidated, and we’re now in a consolidation phase, mirroring Ethereum’s price action. Solana is likely to range within current levels relative to ETH.
If you haven’t moved into ETH yet, consider switching to it closer to the 0.065-0.07 range. For Solana, the price needs to stay above 0.05; otherwise, it may be left behind by Ethereum in Q1. You can view the SOLETH chart here: SOLETH Chart.

Conclusion: Preparing for Q1 2025
In conclusion, Solana remains a promising asset, but its future depends on how the market unfolds in the next weeks. We will continue monitoring the $246 reclaim and potential breakout toward $700. Keep an eye on Ethereum’s performance, as it may outperform Solana if Solana fails to reclaim key levels.
Adapt your strategy to evolving market conditions, and stay updated with the latest signals. Happy trading!

