Mag7 Macro Outlook - Edition #27

#ZoomingOut
The Tech Sector Divide: Will Bearish Giants Sink the Bullish Few?
The tech sector is showing a clear split:
- Bullish Strength: Meta (META), Google (GOOGL), and Amazon (AMZN) are holding strong, with bullish engulfing candles and solid momentum.
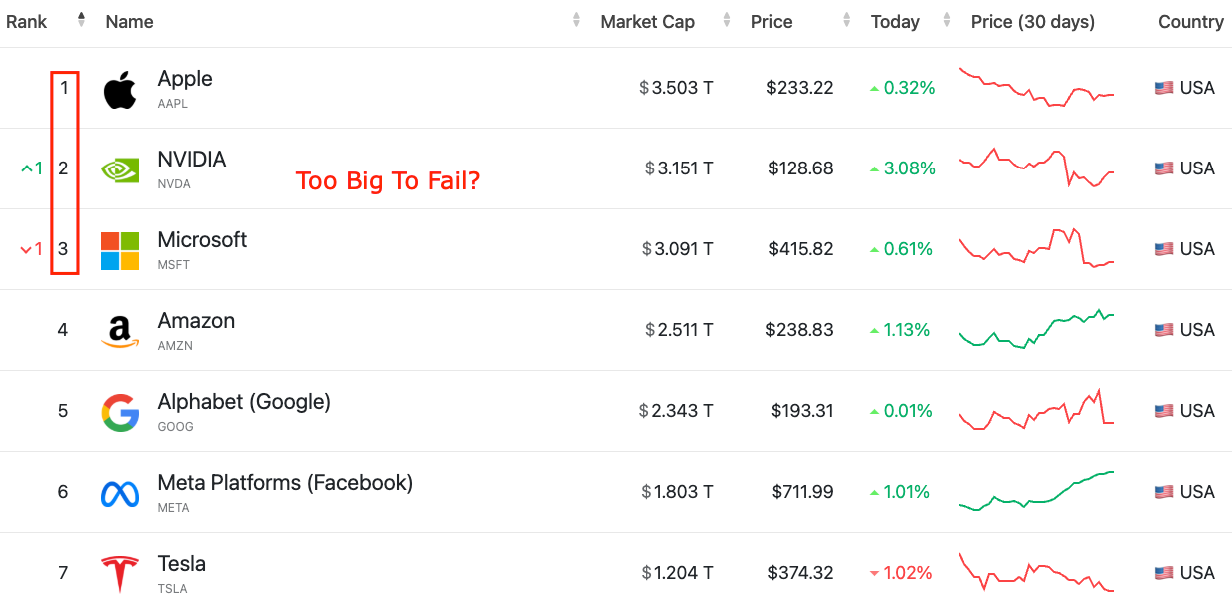
- Bearish Warning Signs: Nvidia (NVDA), Tesla (NVDA), Microsoft (MSFT), and Apple(AAPL) have all printed monthly bearish signals, raising concerns about a potential pullback.
Historically, while the bullish stocks may hold up better initially, a sustained downturn in the bearish names could eventually weigh on the entire sector. Lets not forget that the top tree stocks by market cap are the ones turning bearish. The big question is: If the bearish giants dump, will they drag the few bullish tech stocks down with them?
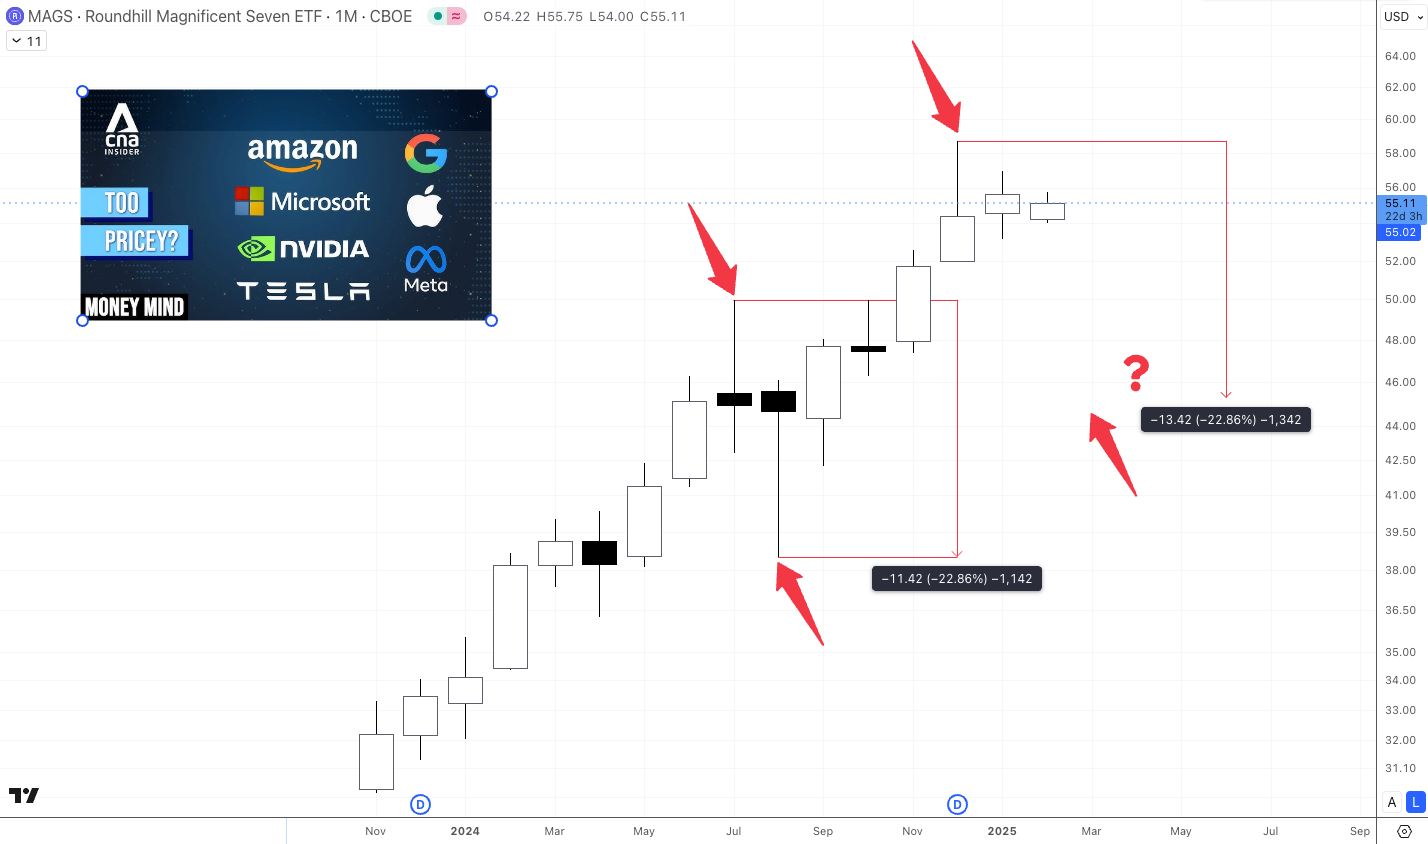
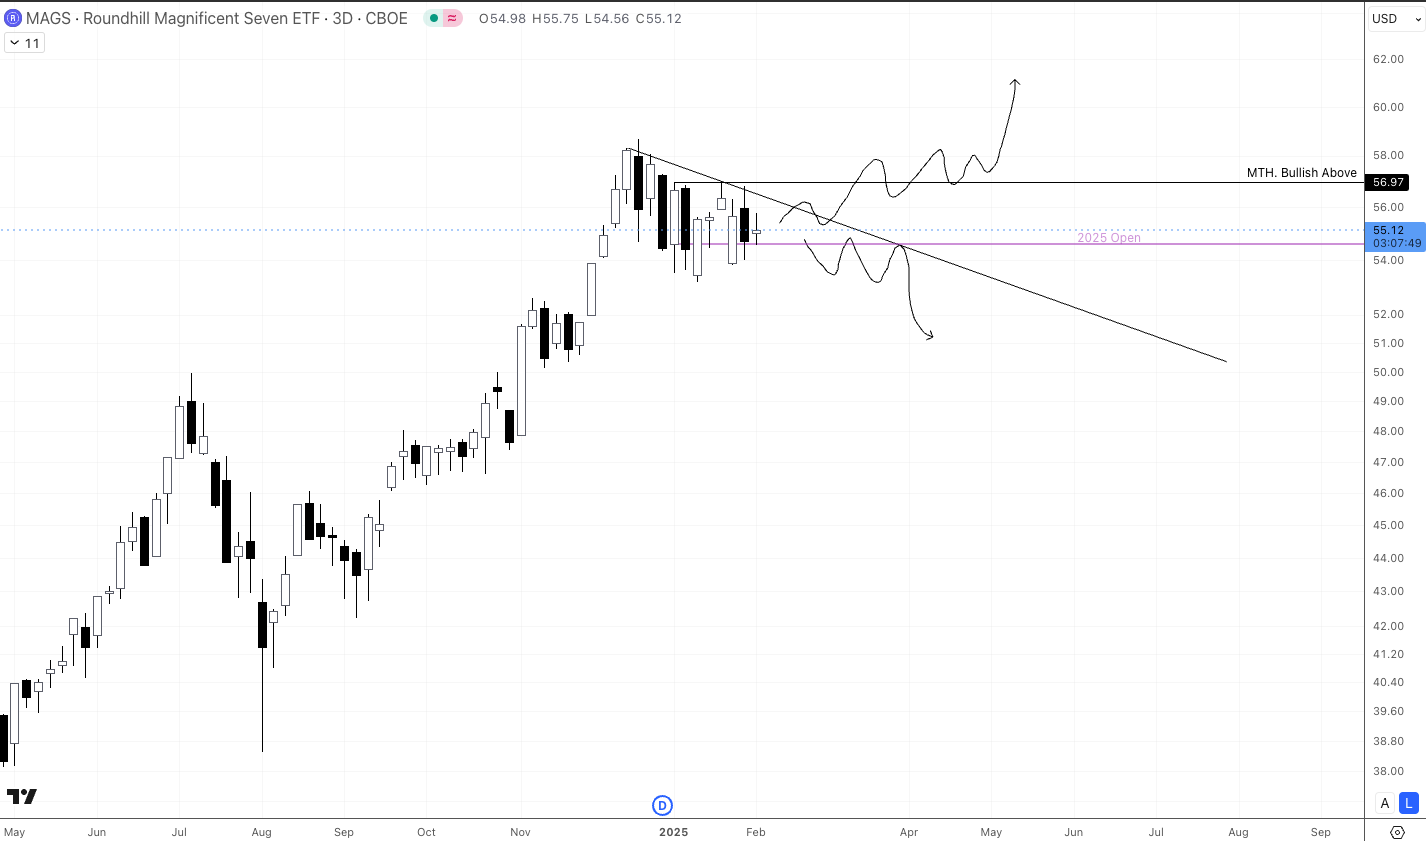
The Roundhill Magnificent Seven ETF $MAGS has had an incredible run, but the monthly chart is sending some cautionary signals. December closed with a massive sell-off wick, followed by a weak January inside bar showing uncertainty in direction. This kind of price action suggests potential exhaustion in the near term.
The last time we saw a similar sell-off wick was in July and it led to a 23% drop before the market resumed its upward trend. Does this mean $MAGS has to plummet again? Not necessarily, but with market uncertainty around the tariff war or any escalation in trade tensions can significantly impact stock prices, particularly for companies with global exposure.
Short-Term Outlook:
As long as price holds above the yearly open, I expect a retest of the $57 resistance level. However, for the macro trend to turn bullish again, we’d need to see strong momentum and a solid close above $57 by flipping this level from resistance to support. Until then, the current price action feels more like a dead cat bounce than a sustainable recovery. Expect volatility in the near term.
⚠️⚠️ Nvidia $NVDA Just Printed a MACRO WARNING SIGN!
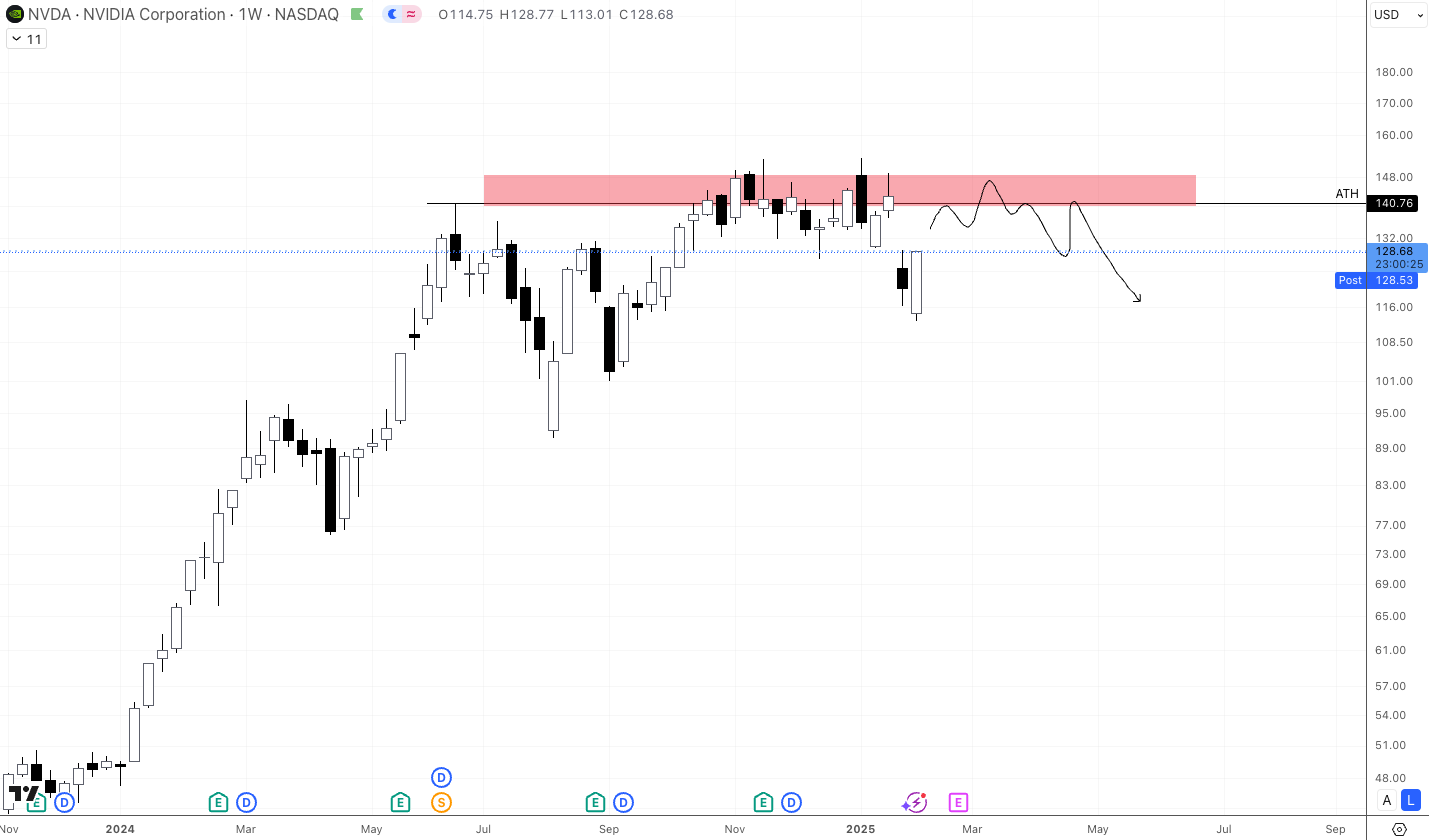
After an incredible rally, Nvidia $NVDA has finally hit a wall at its all−time high of $140, failing to secure a strong monthly close above this critical resistance level. This stagnation at the peak is a red flag for the stock’s near-term momentum.
Since the rally began in 2016, the monthly chart has been overwhelmingly bullish, with only a few exceptions: 2018, 2022, and now 2024, where the monthly chart has printed a bearish engulfing candle. Historically, when this pattern has appeared, it has led to steep retraces.
Based on the median pullback from the past two occurrences, we could see a 50% decline by mid 2025 from current levels, a potential bloodbath for unprepared investors. Is this a guaranteed outcome? Of course not. But higher timeframes carry significant weight in macro price action, and this bearish signal is too significant to ignore. Tesla is the second largest tech company by market cap. What do you all think will happen if price plummets? Stay alert!

While a short-term pump toward the $140s is more than likely, it’s important to recognize that this move will feel more like a dead cat bounce than a sustainable recovery. For those considering a short position, this potential bounce could offer the perfect entry point.
However, unless NVDA can achieve a strong break above $150 and successfully flip this level into support, there’s no compelling reason to turn bullish here. The macro warning signs remain intact, and the risk of a deeper retrace looms large.
⚠️⚠️ Mission ABORTED! Microsoft $MSFT Monthly Chart Flashes Warning Signs
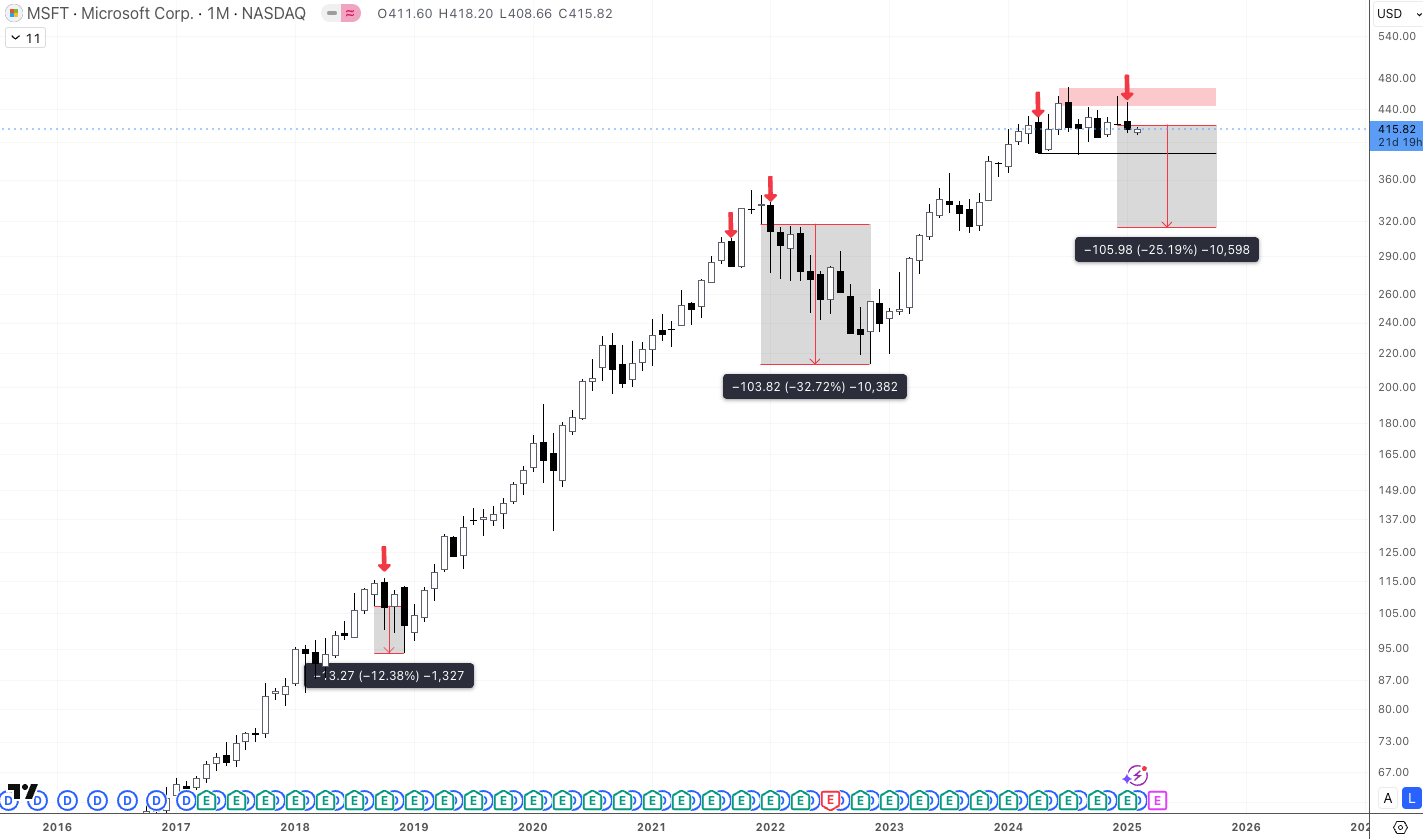
The monthly chart has just thrown a major warning sign for the months ahead. Since 2017, the stock has been on a mostly upward trajectory, with a few exceptions: 2018, 2022, and now 2024, where the monthly chart has closed with a bearish engulfing candle. Historically, this pattern has been followed by steep retraces. Will this time be different? I highly doubt it.
At this point, there’s no reason to consider macro long positions. Instead, it’s time to take profits across the boards and wait for clearer signals. In the short term, a pump toward the $460s is possible, but unless price achieves a strong break above the previous all-time high and flips this level into support, there’s no justification for renewed bullish optimism.
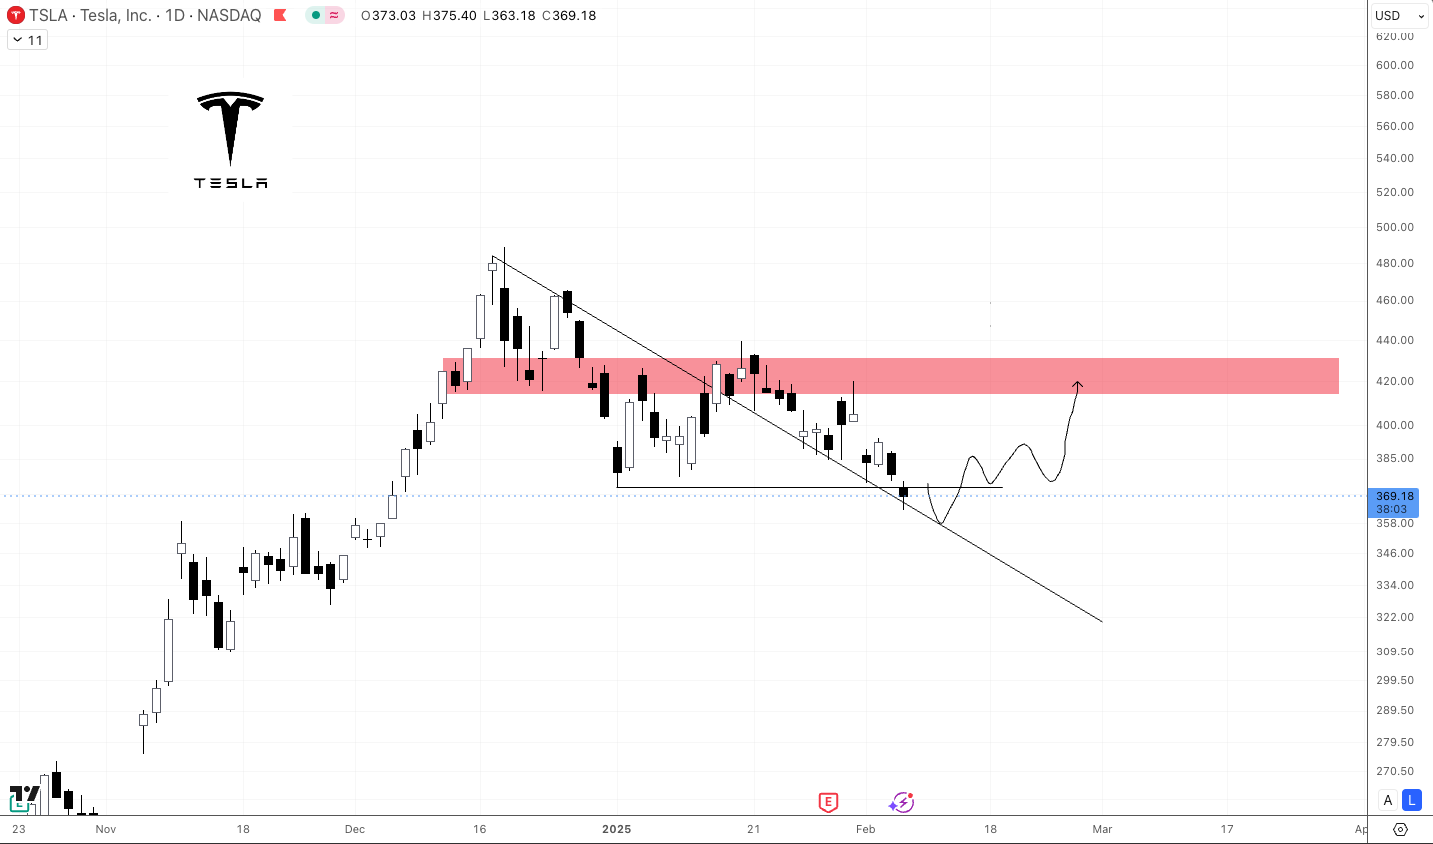
⚠️⚠️ Tesla $TSLA continues to struggle, failing to secure a strong monthly close above its previous all−time high of $415. Similar to the $MAGS ETF, Tesla’s monthly chart shows a significant sell-off wick in December, followed by a weak January close that formed an inside bar. This price action signals potential exhaustion and a lack of bullish momentum.
For those still holding positions, profits should have been taken by now. Looking ahead, the ideal re-entry zone for a macro long position appears to be in the low $300's - $200's standing out as the sweet spot for a strategic MACRO long.
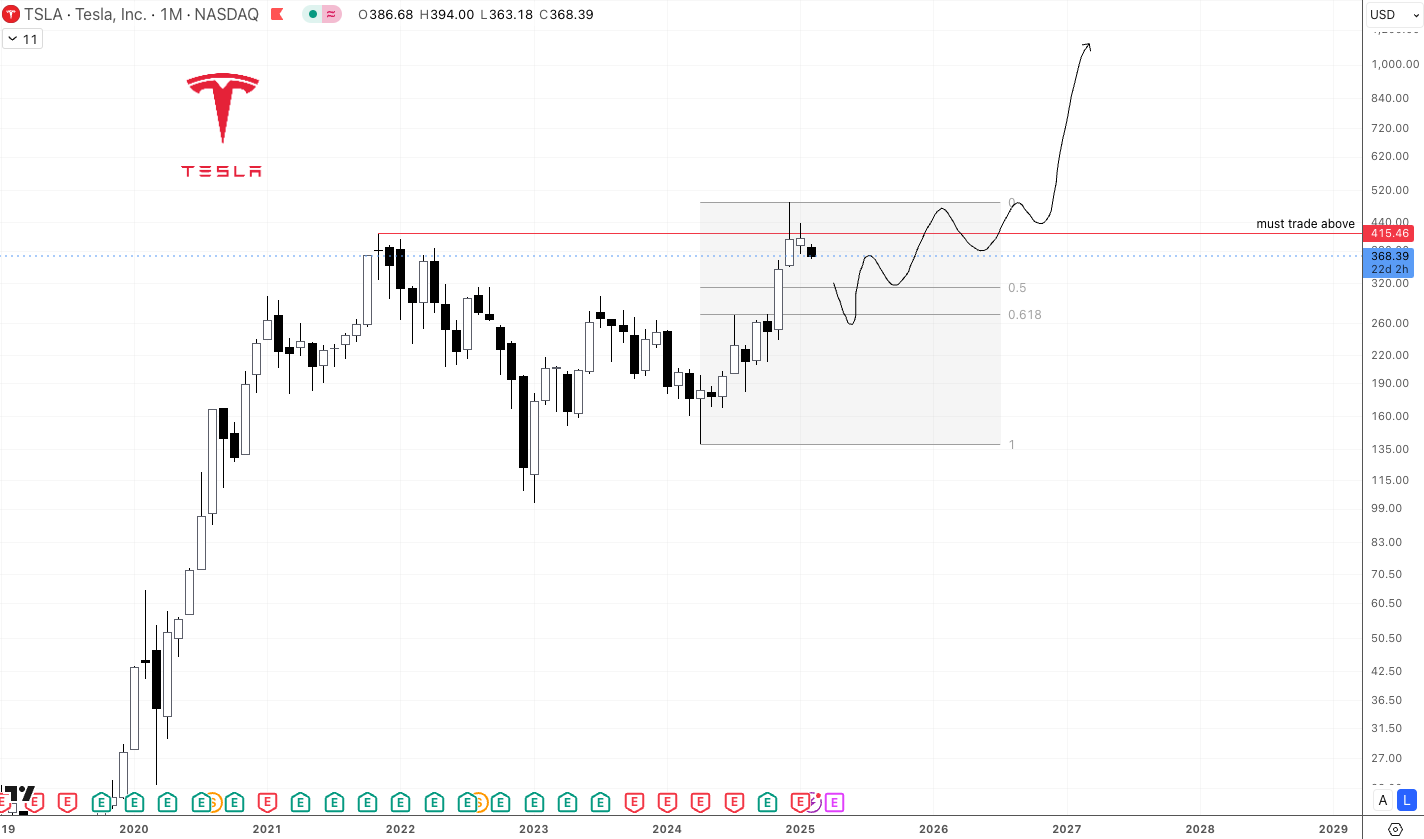
In our previous post, we highlighted the importance of respecting the most recent lows. Unfortunately, price has already swept through these levels. While a short-term pump toward the $420's is still possible, and even likely, Tesla must reclaim support above $420 for further upside hopes. For now, the macro bias leans toward further downside before any meaningful upside continuation.
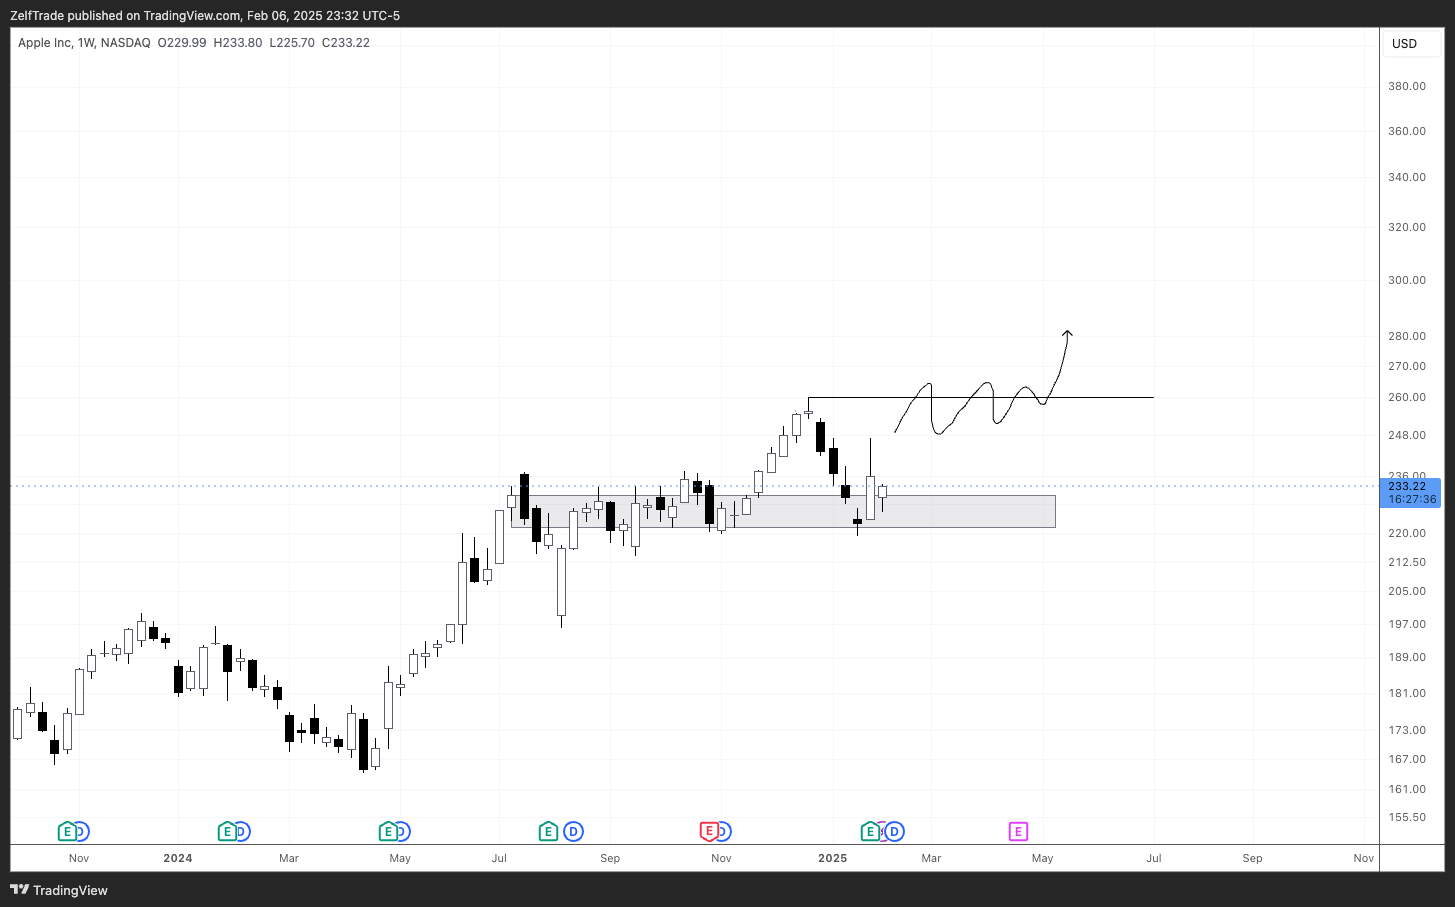
⚠️ Apple ($AAPL): Bearish Engulfing Candle Raises Caution
Apple did not have an ideal monthly close, with January ending in a bearish engulfing candle. While the strong buy represented by the wick provided some relief, the overall macro signal remains bearish and should be treated as such.
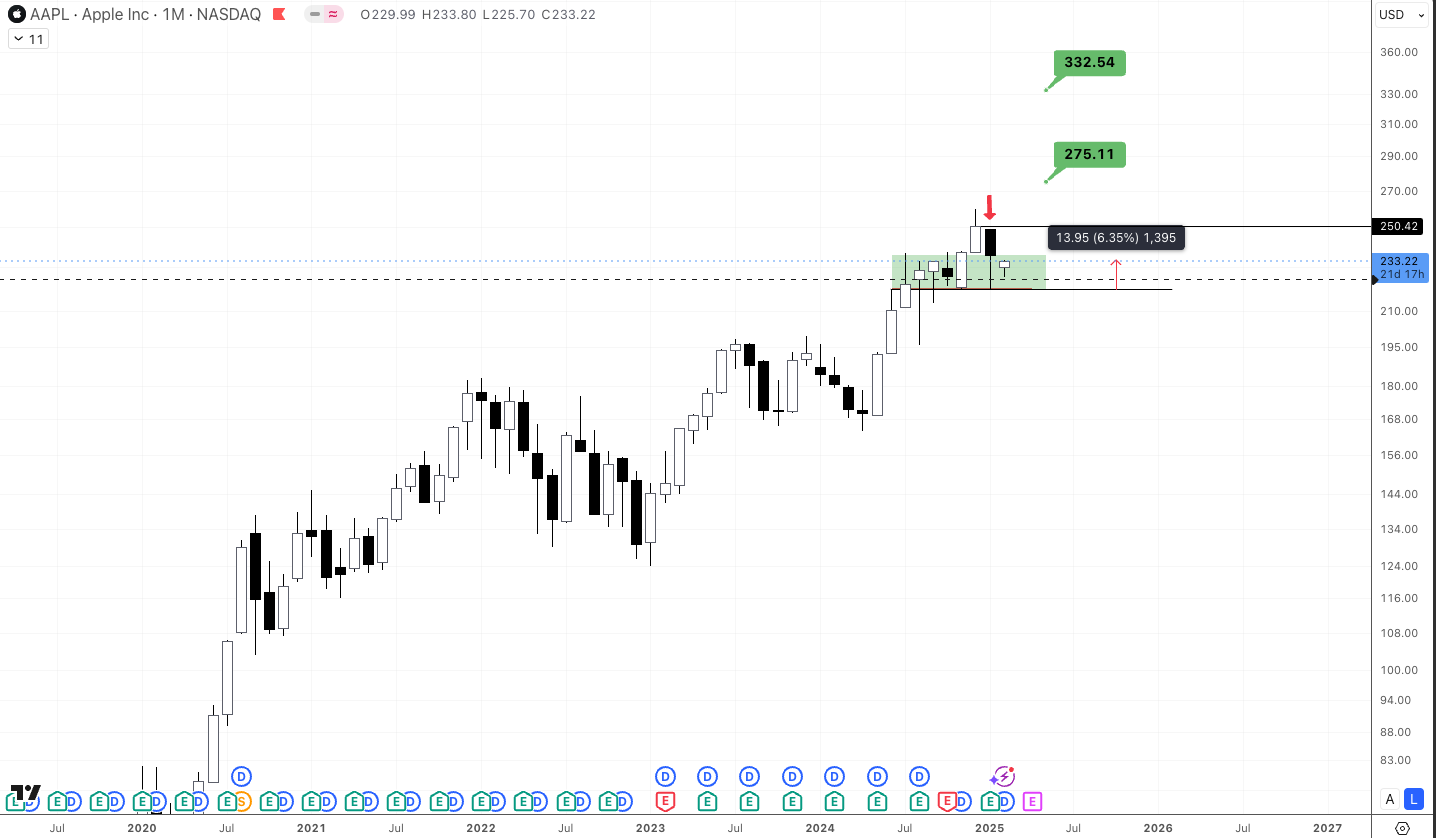
Price is currently up +6% from our previous entry signal, which is great, but this is not a long-term hold. I plan to sell around the $250 resistance level. Unless we see a higher high above the previous all-time high, there’s no reason to get excited here. Instead, it’s better to take profits at resistance and wait for clearer signals. If price flips bullish later, we can always re-enter with better confluence for further upside. For now, caution is key.
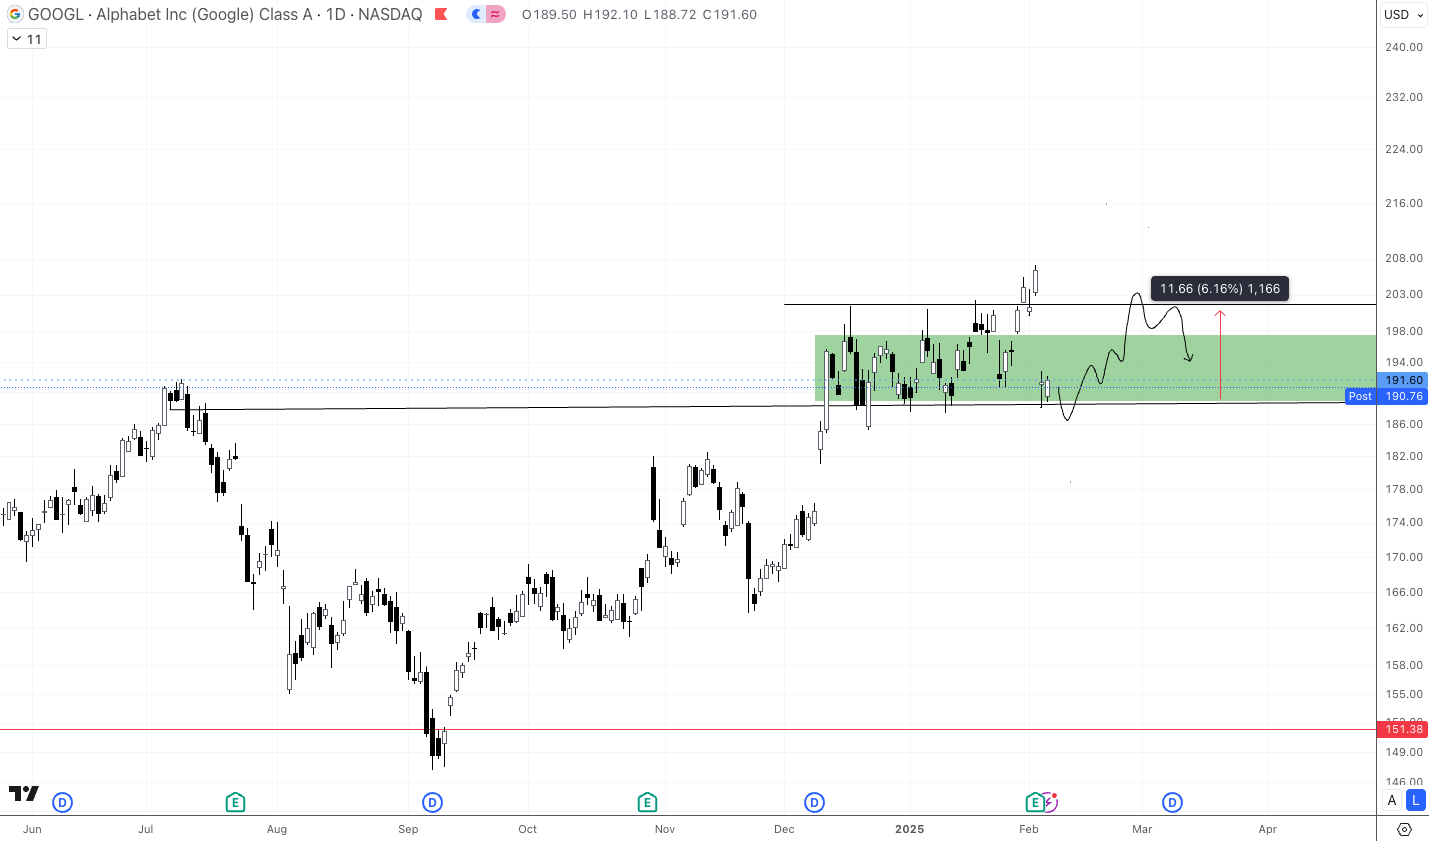
🚀⚠️ Google $GOOGL: Bullish but Playing with Fire
The monthly chart for Google looks bullish, but caution is warranted. With tech giants like Nvidia and Tesla showing signs of exhaustion, a potential retrace in these high-flyers could drain liquidity from the tech sector, dragging most stocks down with them.
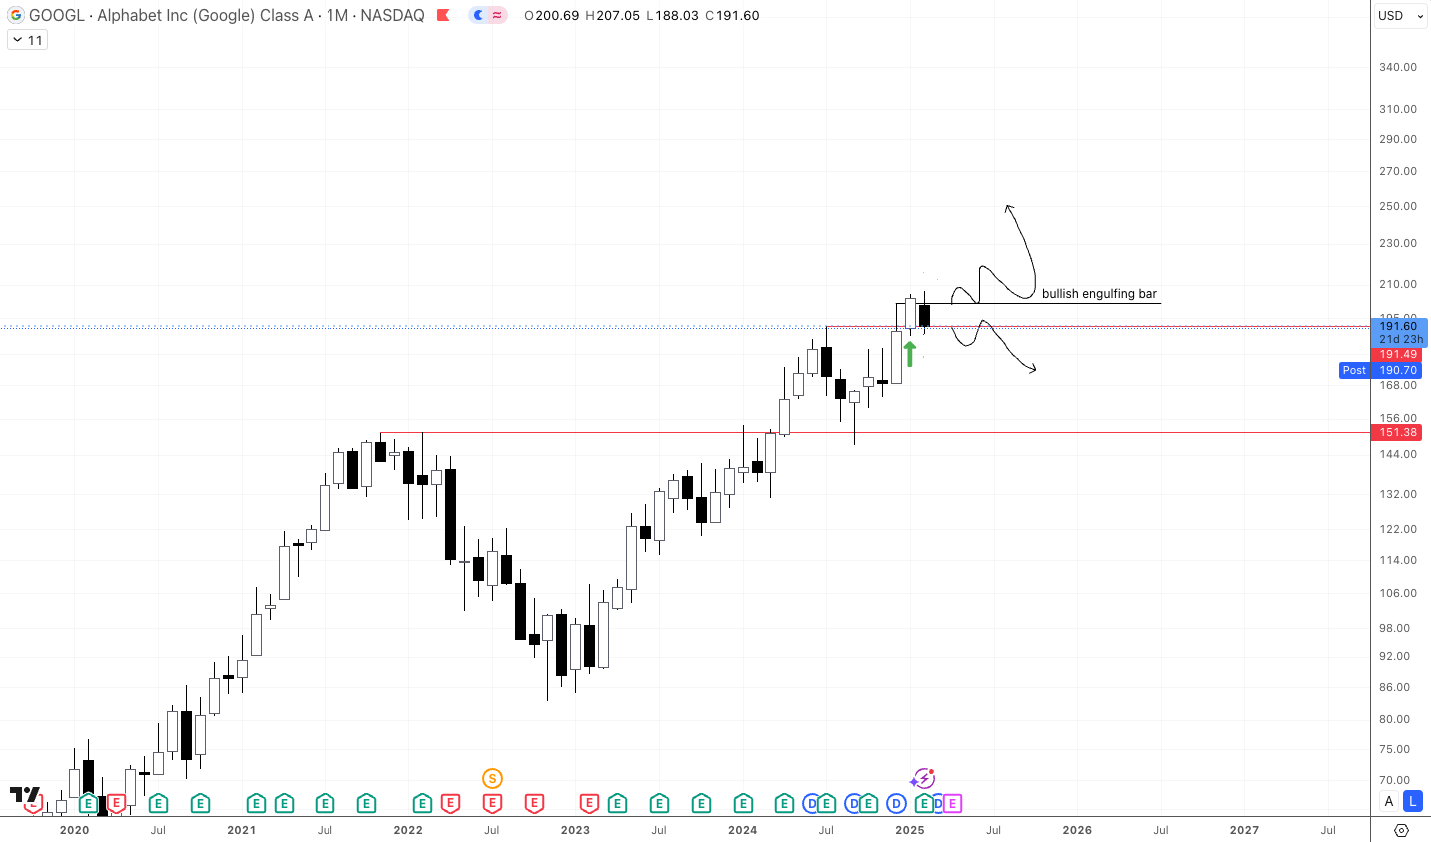
Among the Magnificent 7 tech stocks, Google stands out as one of the more undervalued names, and it’s likely to outperform in the long run. However, for now, the only viable play appears to be a range-bound strategy. Buying at market price and selling near the range high at $202 offers a 6% swing trade opportunity.
For the macro outlook to turn bullish, we’d need to see strong momentum pushing prices well above $202 and flipping this level into support. Until then, the macro stance remains neutral. Tread carefully—volatility in the tech sector could spill over.
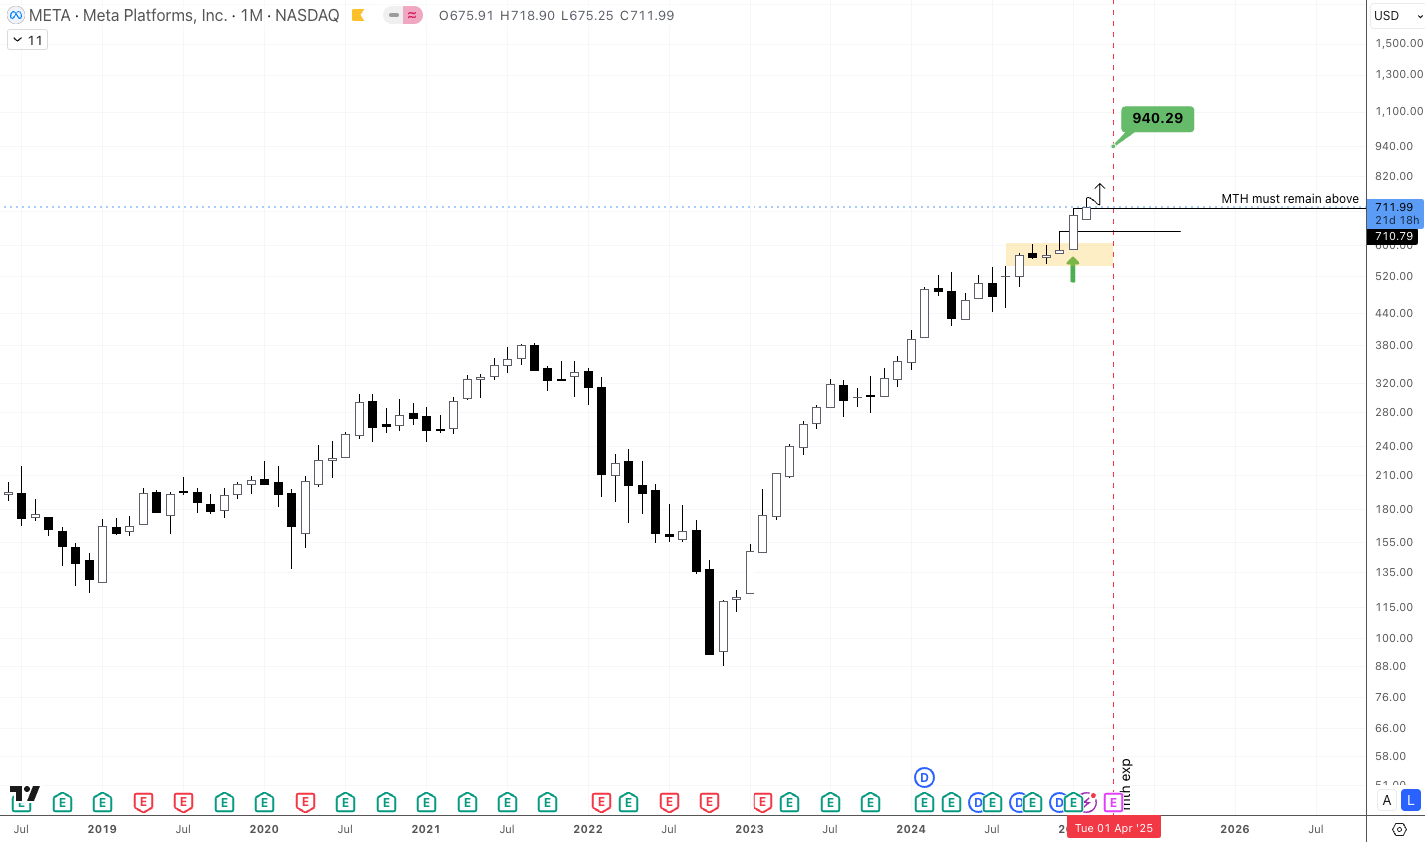
🚀🚀 $META: Bullish Momentum Continues with +21% Profit
The monthly chart has just printed a bullish engulfing candle which is great for better macro confluence. Meta remains firmly in bullish territory, delivering a solid +21% profit from our previous entry signal. With the first target already hit, it’s wise to take partial profits at market price and lock in some gains.
In the short term, price needs to reclaim and hold support above the $712 monthly level to fuel the next leg up toward our $940 target. Any pullback toward the $620s should be viewed as a buying opportunity. Meta’s momentum remains strong, and the setup looks promising for further upside.
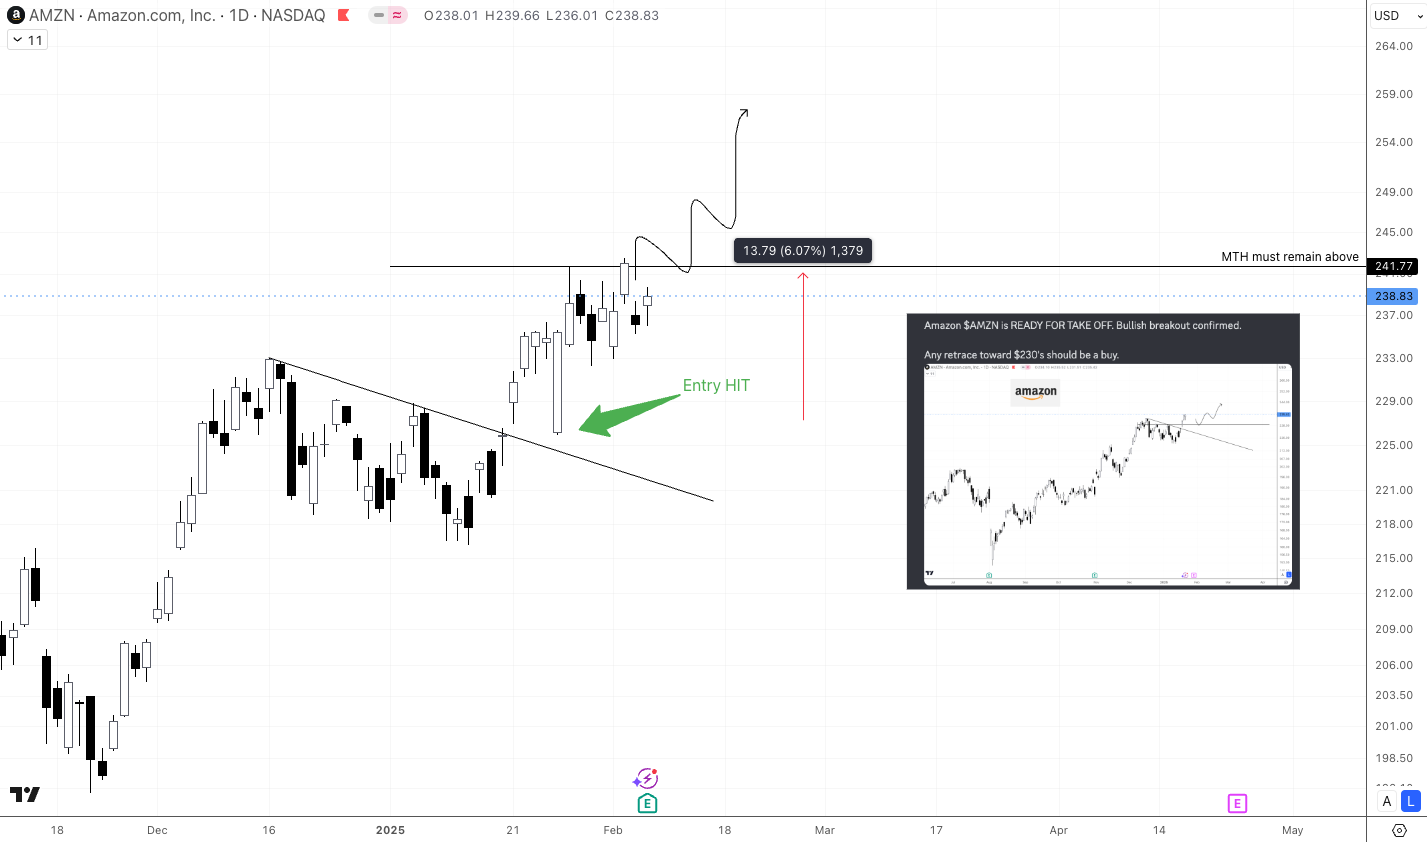
🚀🚀 Amazon ($AMZN): Bullish Engulfing Candle Signals Strength
Amazon just closed January with a bullish engulfing monthly candle, highlighting strong price action and setting the stage for further upside. With this macro confirmation, our next target is $280.
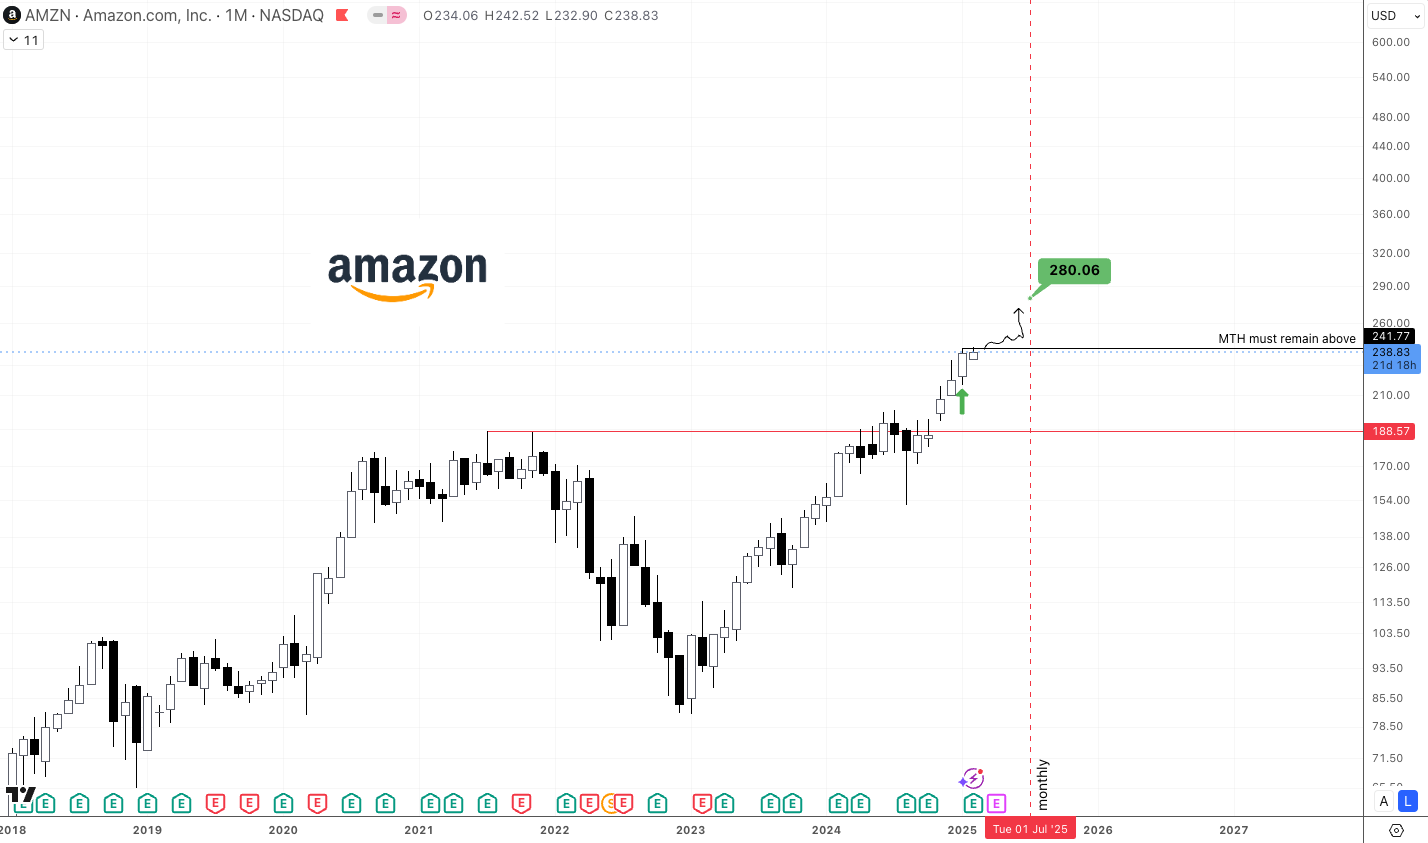
As mentioned in our last post, bullish momentum was confirmed, and the ideal entry zone was around $230—a level we were fortunate to hit. Price is now up +6% from that entry, and it’s a good time to consider taking small profits at these highs.
For the rally to continue, we need to see a strong close and flip of the $242 level into support. This will be a critical confirmation of further upward momentum. Overall setup looks promising, but patience is key.
Previous report HERE:

Disclaimer
Not financial or tax advice. Zelf Trade is not a financial institution. No content on this Newsletter is financial, accounting, legal or tax advice. Zelf Trade content is strictly educational and is not investment advice or a solicitation to buy or sell any assets or to make any financial decisions. This newsletter is not tax advice. Talk to your accountant. Do your own research.