Mag7 - Edition #28


Did you miss our last report? Don’t worry, we’ve got you covered—link below.
Did you actually read it? Great! But let’s be honest, you probably skimmed it while pretending to work, so here’s the link again. This isn’t just another boring economics paper—it’s your crystal ball for the weeks and months ahead. Inflationary pressures? Check. Geopolitical drama? Double-check. The Fed playing puppet master with the markets? Oh, you bet. Strap in, because the future is looking wild. Let’s dive in before the next market plot twist hits!
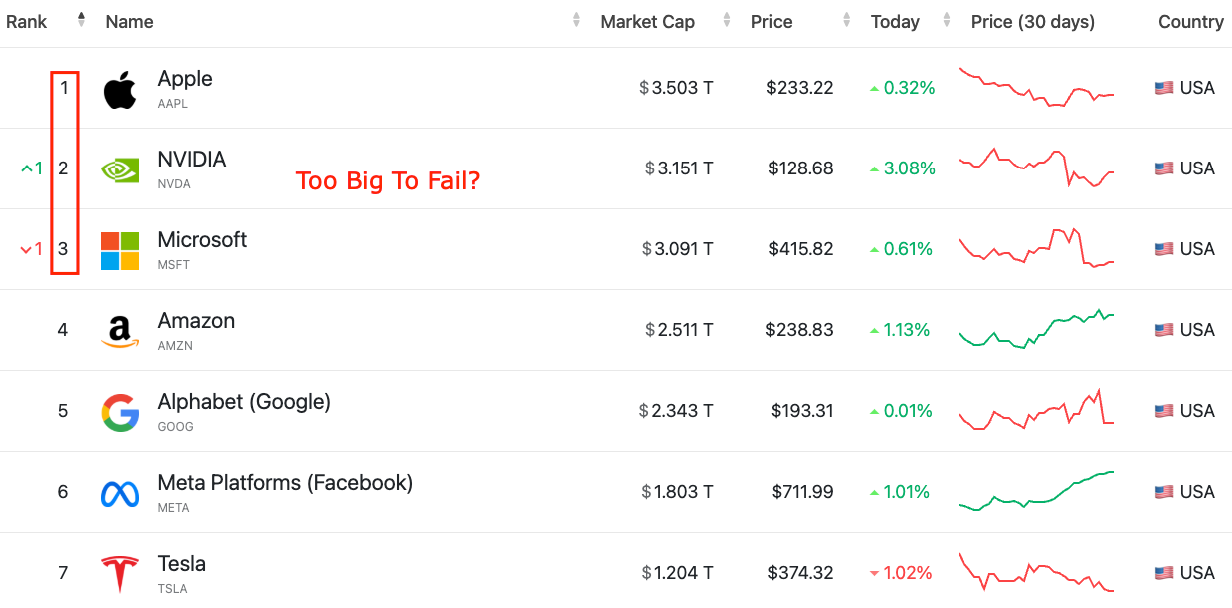
Lets start with the good stuff!
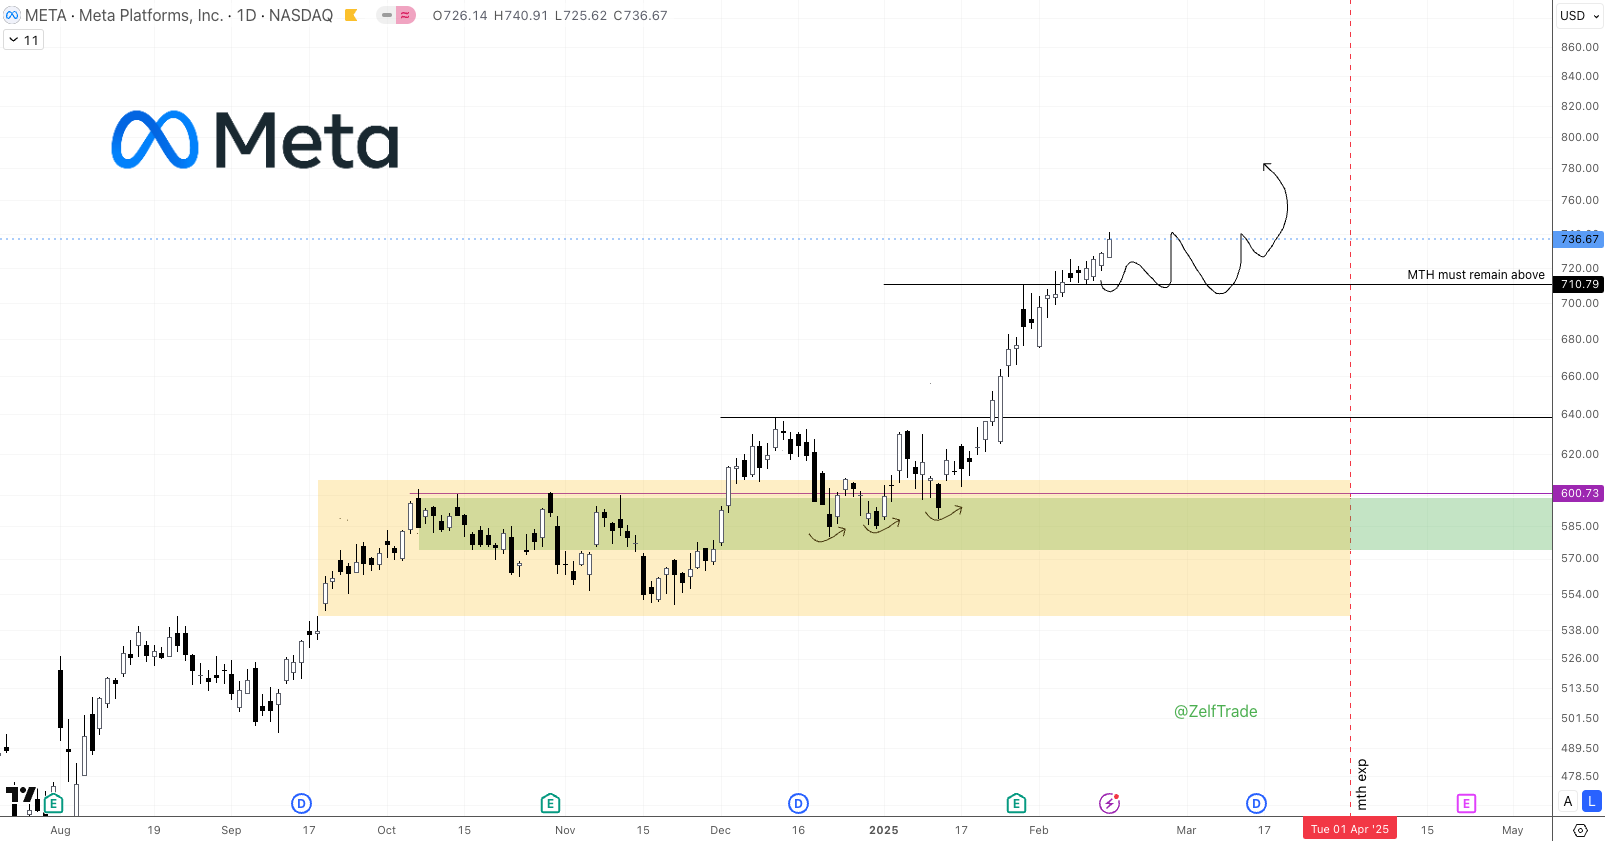
🚀 Meta Keeps Pumping ✅ +27% – Bullish Momentum's Intact
Bullish momentum continues to impress, with the stock pumping higher. The monthly bullish engulfing candle we highlighted on our previous report has provided strong macro confluence, and the technical setup remains firmly in favor of further upside.
With a solid +21% profit already booked from our previous entry signal, it’s a great time to lock in partial profits again here at +27% and let the rest of the position ride. This approach balances risk management with the potential for further gains.
As long as $710 holds as support, the bullish outlook remains intact. This level is critical for sustaining the upward momentum and fueling the next leg higher.
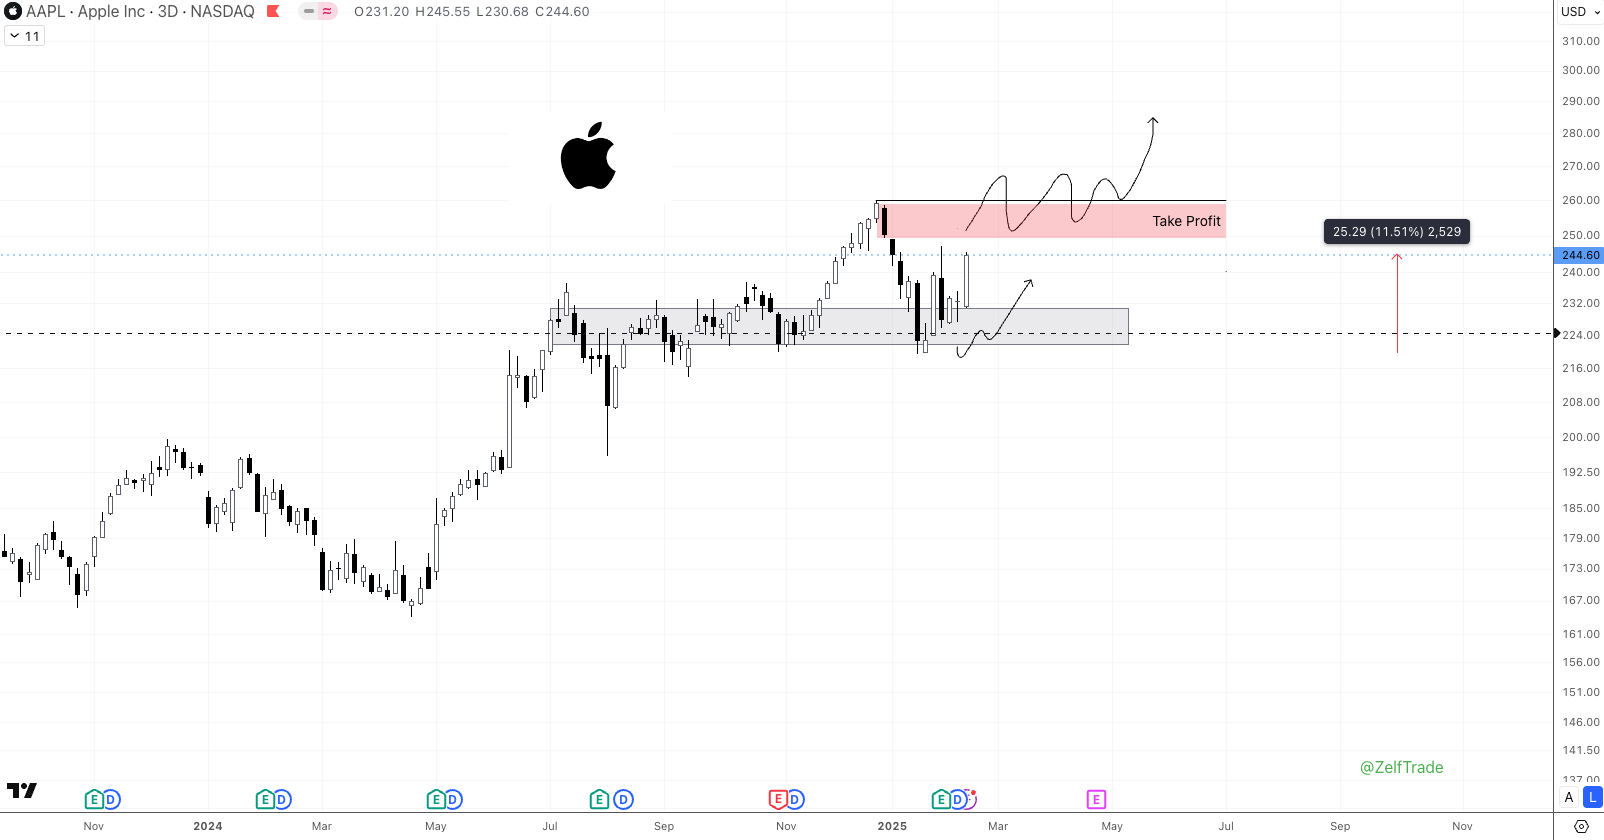
🚀 Apple $AAPL Trade is Up +11% ✅ and Nearing Take Profit Zone
Price action has been bullish since our entry, with the stock now nearing the $250's resistance zone. This aligns with our initial plan to take profits at this level, as it represents a logical area for sellers to step in.
No Higher High Yet: Despite the rally, Apple has not yet broken above its previous all-time high. Without a confirmed higher high, the bullish case remains unconvincing, and this move is still best viewed as a counter-trend rally within a broader range.
⚠️ MACRO! Monthly Bearish Engulfing Candle Still Dominates: The January monthly close formed a bearish engulfing pattern, which historically signals potential downside momentum. This pattern has not been invalidated, and the lack of bullish follow-through in February reinforces its significance.
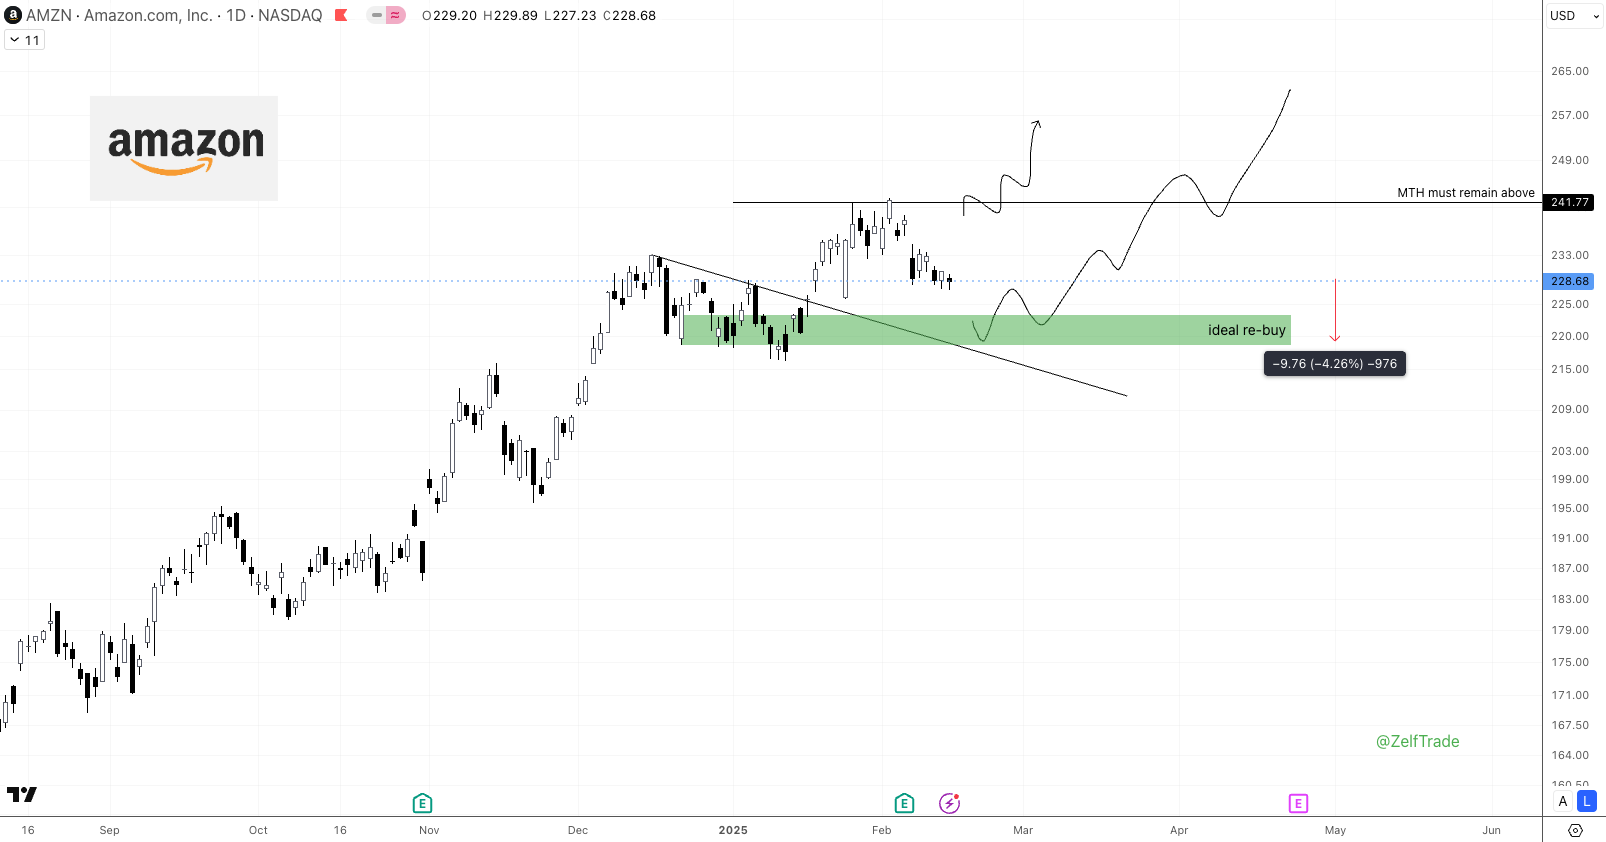
🚀 Back to Square One At Break Even on Amazon $AMZN But Macro BULL
In our last update, we highlighted the importance of a strong close and flip of the $242 level into support to confirm further upward momentum. Unfortunately, price has failed to achieve this, and the bullish momentum has stalled.
Small Profits Locked In: As recommended, taking small profits at the recent highs was a prudent move. This reduces risk and locks in gains while allowing you to stay positioned for potential upside if the market turns. We took some off at +6% ✅ and we are back at break even on the rest. Now is a good time to take more off the position and re buy at around $220 as the macro remains bullish.
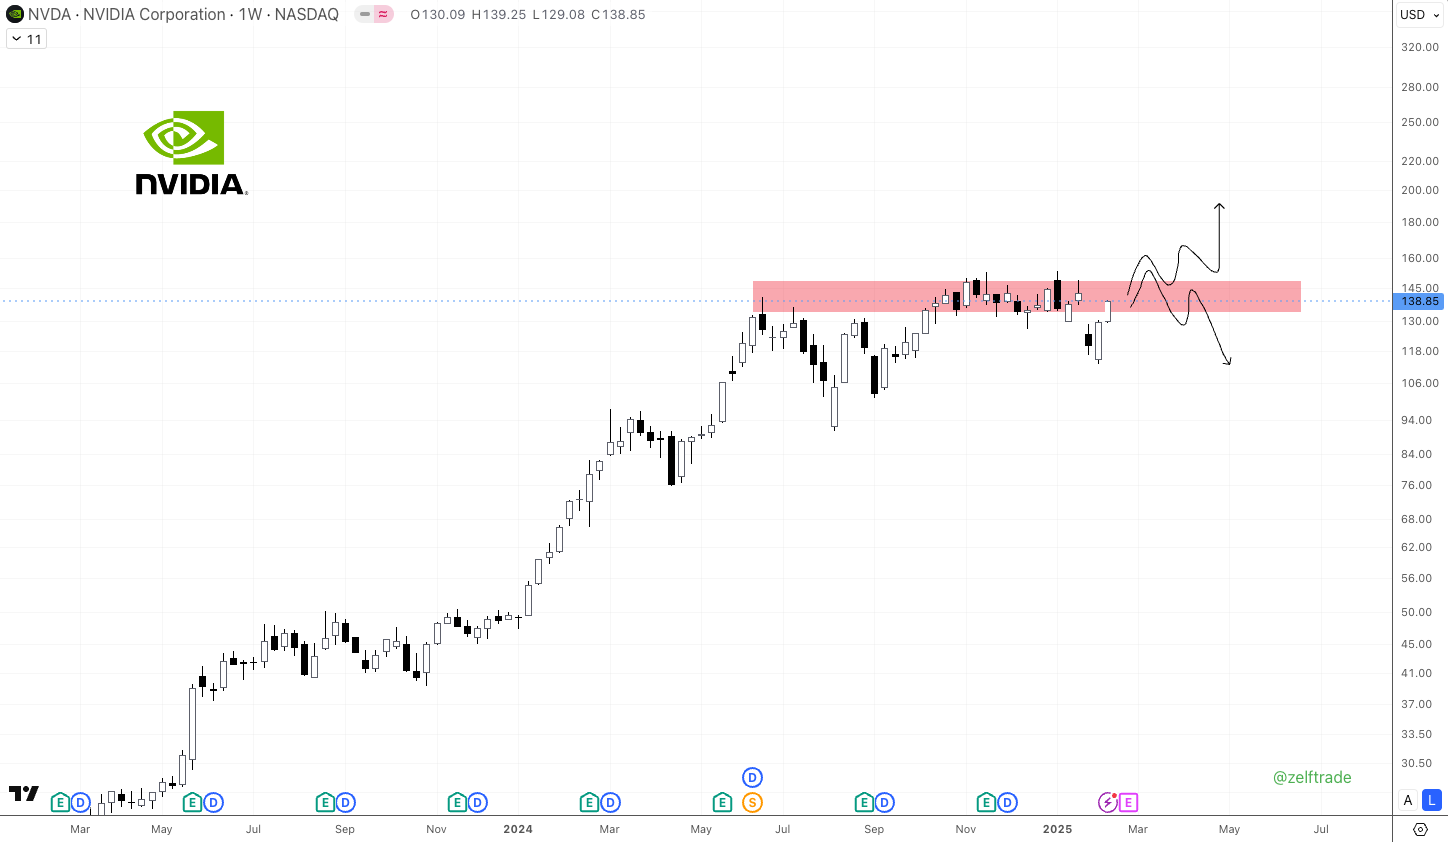
⚠️ Nvidia $NVDA Approaching the $140 Mark. Perfect short?
Our previous analysis suggesting a short-term pump toward this level appears to be playing out. This move toward $140 aligns with the expectation of a temporary bounce. ⚠️ However, the broader context and technical indicators still suggest caution for investors and traders ⚠️ This rally, while notable, continues to exhibit characteristics of a "dead cat bounce" rather than a sustainable recovery. Volume and market sentiment indicate that this upward movement lacks the strength typically associated with a long-term reversal.
The critical level of $150 remains a significant barrier. As previously highlighted, NVDA would need to achieve a strong break above $150 and convert this level into support to signal a potential shift in market structure. Until this occurs, the bullish case remains unconvincing.
For those considering short positions, the current rally toward $140's may still present an attractive entry point. The lack of strong fundamental catalysts and the overhang of macro risks suggest that the upside potential is limited, while the downside risk remains significant.
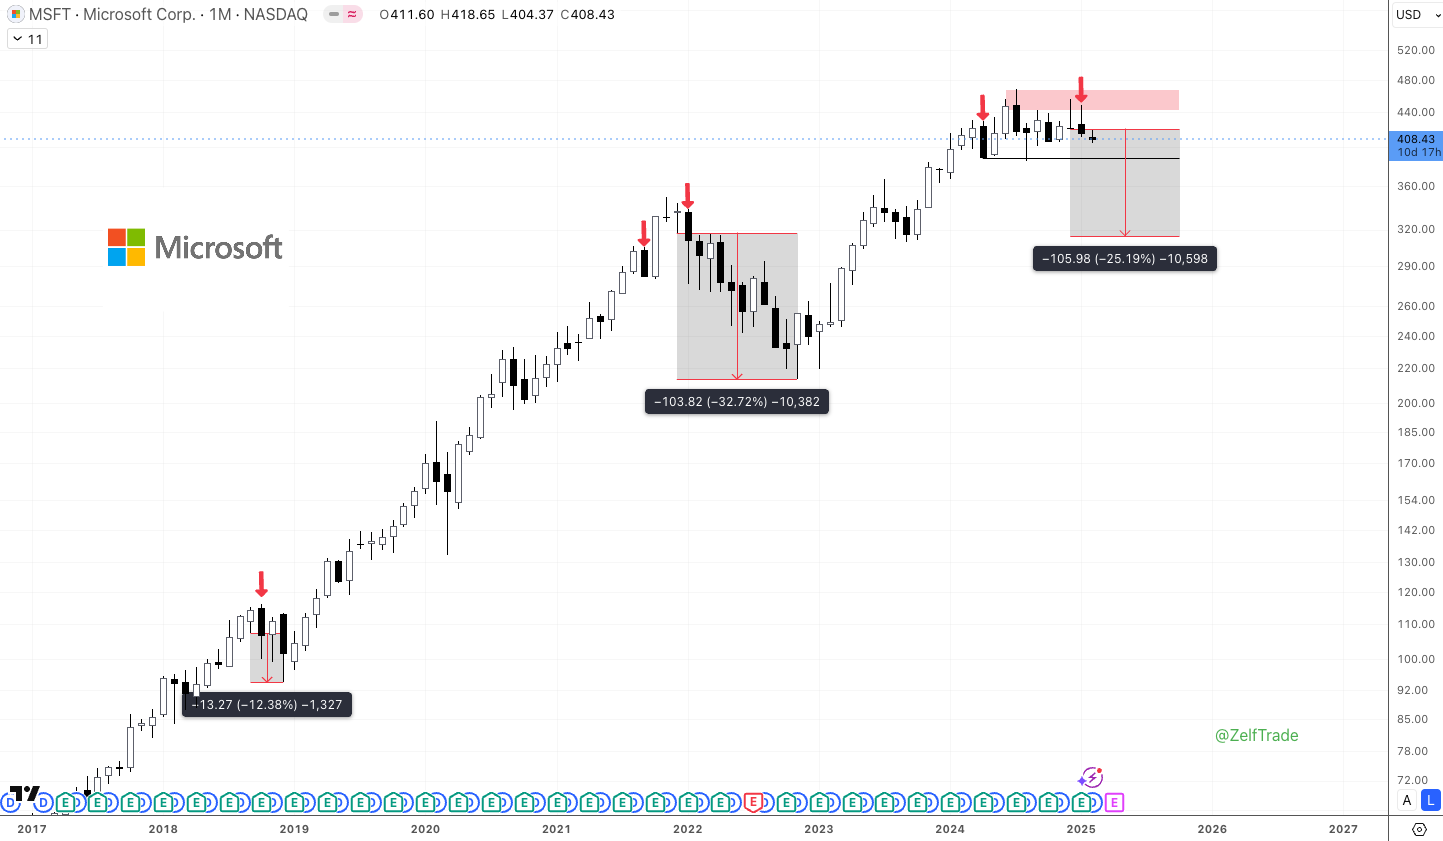
⚠️ Microsoft $MSFT Stuck in Neutral
Since our last report, $MSFT stock’s price action has been relatively stagnant, failing to deliver any meaningful moves in either direction. While this may feel like a calm before the storm, the bearish engulfing candle on the monthly chart—a pattern that has historically preceded steep retraces continues to loom large.
Monthly Bearish Engulfing Candle Still in Play: The monthly chart’s bearish engulfing candle, a pattern last seen in 2018 and 2022, remains a significant warning sign. Both previous instances were followed by substantial pullbacks, and there’s little evidence to suggest this time will be different. The lack of upward momentum since the pattern formed only reinforces the bearish case. There’s still no compelling reason to consider macro long positions.
Short-Term Pump Potential: While a short-term pump toward the $460s is still possible, such a move would likely be a selling opportunity rather than a reason to turn bullish. Without a strong break above the previous all-time high and a successful flip of that level into support, any rally is likely to be short-lived.
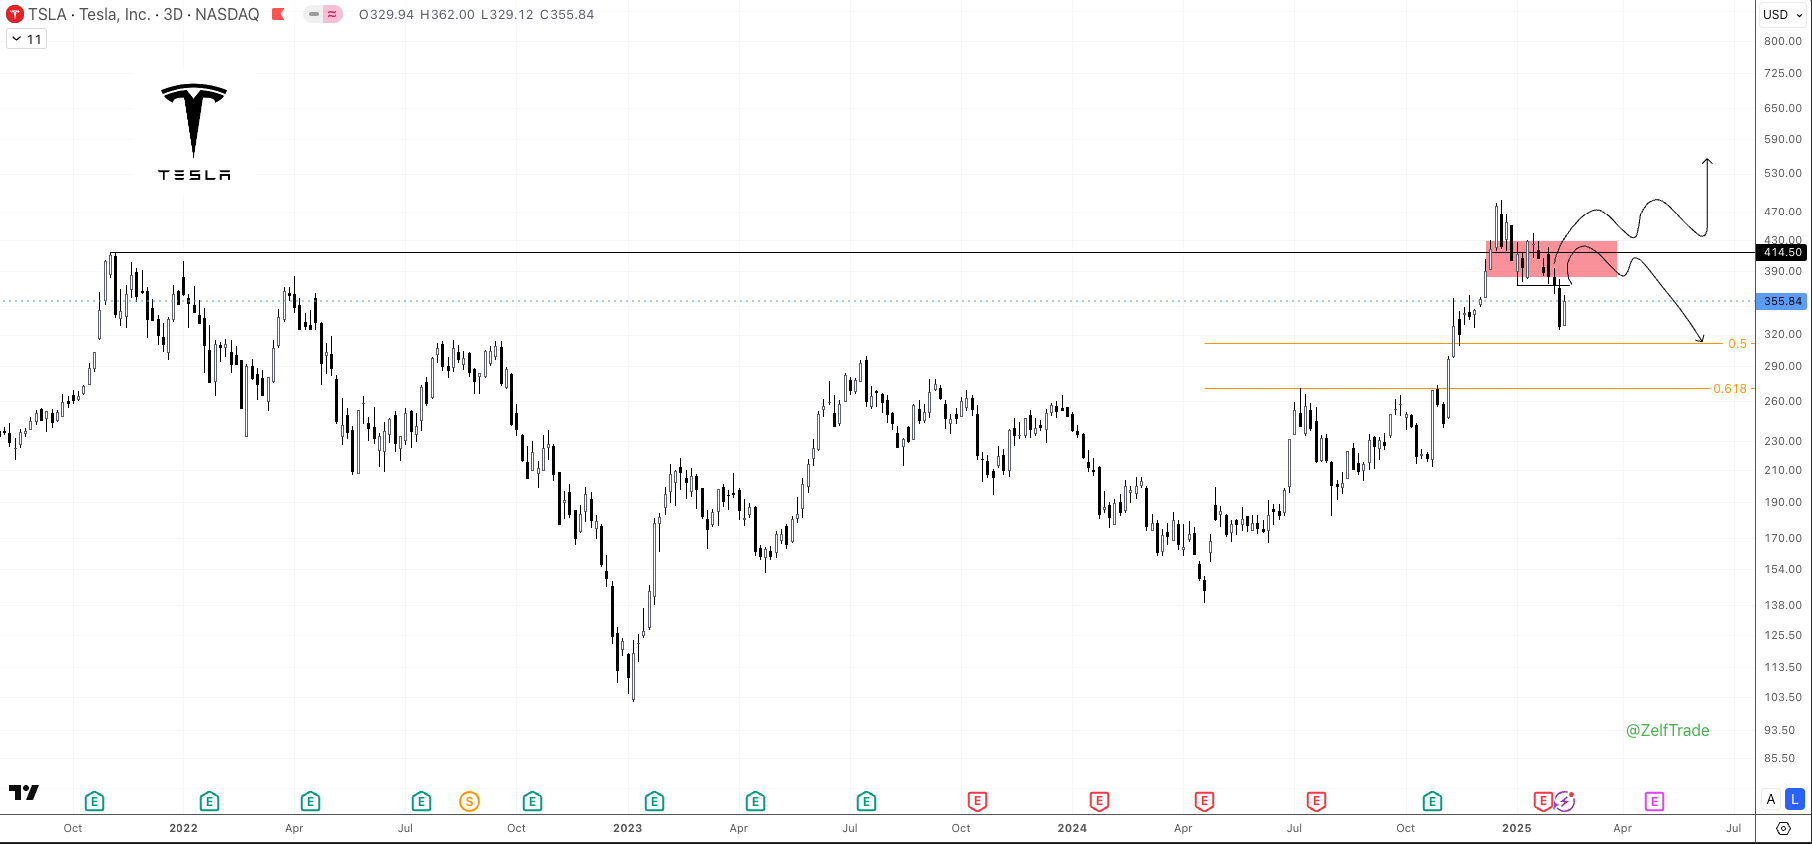
⚠️ Tesla $TSLA Currently Pumping Toward Resistance
In our last update, we emphasized the critical importance of holding the most recent lows. Unfortunately, price has already swept through these level, confirming a breakdown and reinforcing the bearish bias. While the market is now experiencing a short-term pump toward the $420 resistance zone, the broader outlook remains cautious ⚠️ This breakdown suggests that sellers are in control, and any upward moves are likely to be corrective rather than trend-changing.
A short term bounce toward the $420 resistance zone is likely underway. This move is typical after a breakdown, as markets often retest former support-turned-resistance. However, without a strong reclaim above $420 as support, this pump is unlikely to sustain.
Macro Bias Remains Bearish: The broader macro environment continues to favor downside risk. The path of least resistance remains downward.
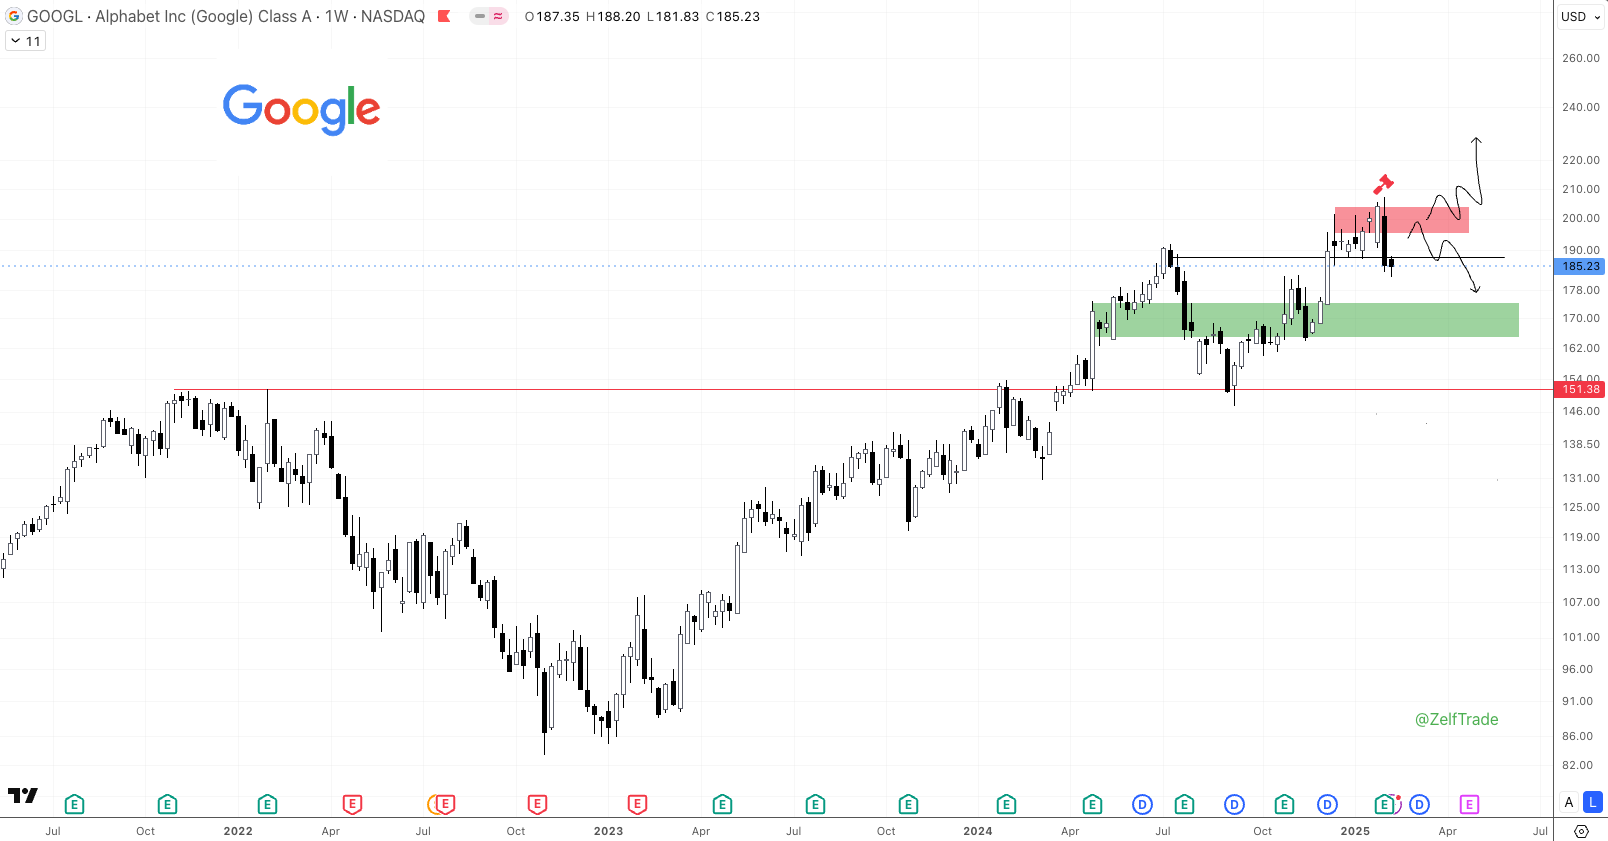
⚠️ Google Range-Bound Trade Invalidated
The previous range-bound strategy for GOOGL, which involved buying near support and selling near the range high at $202, has been invalidated by the confirmation of a weekly bearish engulfing candle shifting the outlook from neutral to bearish. Further downside is likely.
The breakdown below the range and the bearish engulfing candle signal that the stock is now in a downtrend, not a consolidation phase.
Key Levels to Watch:
- Resistance: The $190-200 zone is now a critical resistance area. Any bounce toward this level is likely to face strong selling pressure.
- Support: The next major support level is near $170's. A break below this level could accelerate the downtrend and open the door to further losses.
Disclaimer
Not financial or tax advice. Zelf Trade is not a financial institution. No content on this Newsletter is financial, accounting, legal or tax advice. Zelf Trade content is strictly educational and is not investment advice or a solicitation to buy or sell any assets or to make any financial decisions. This newsletter is not tax advice. Talk to your accountant. Do your own research.