Is the Last Dance Approaching for Crypto?

With the market trending weekly, excitement is building around the idea of the "last dance" or perhaps the "last leg." What does this mean? Crypto has consistently respected its cycle tops and lows, which suggests we might be heading for one final push until the end of July 2025. Notably, time@mode analysis has proven effective at pinpointing tops, adding to the anticipation.
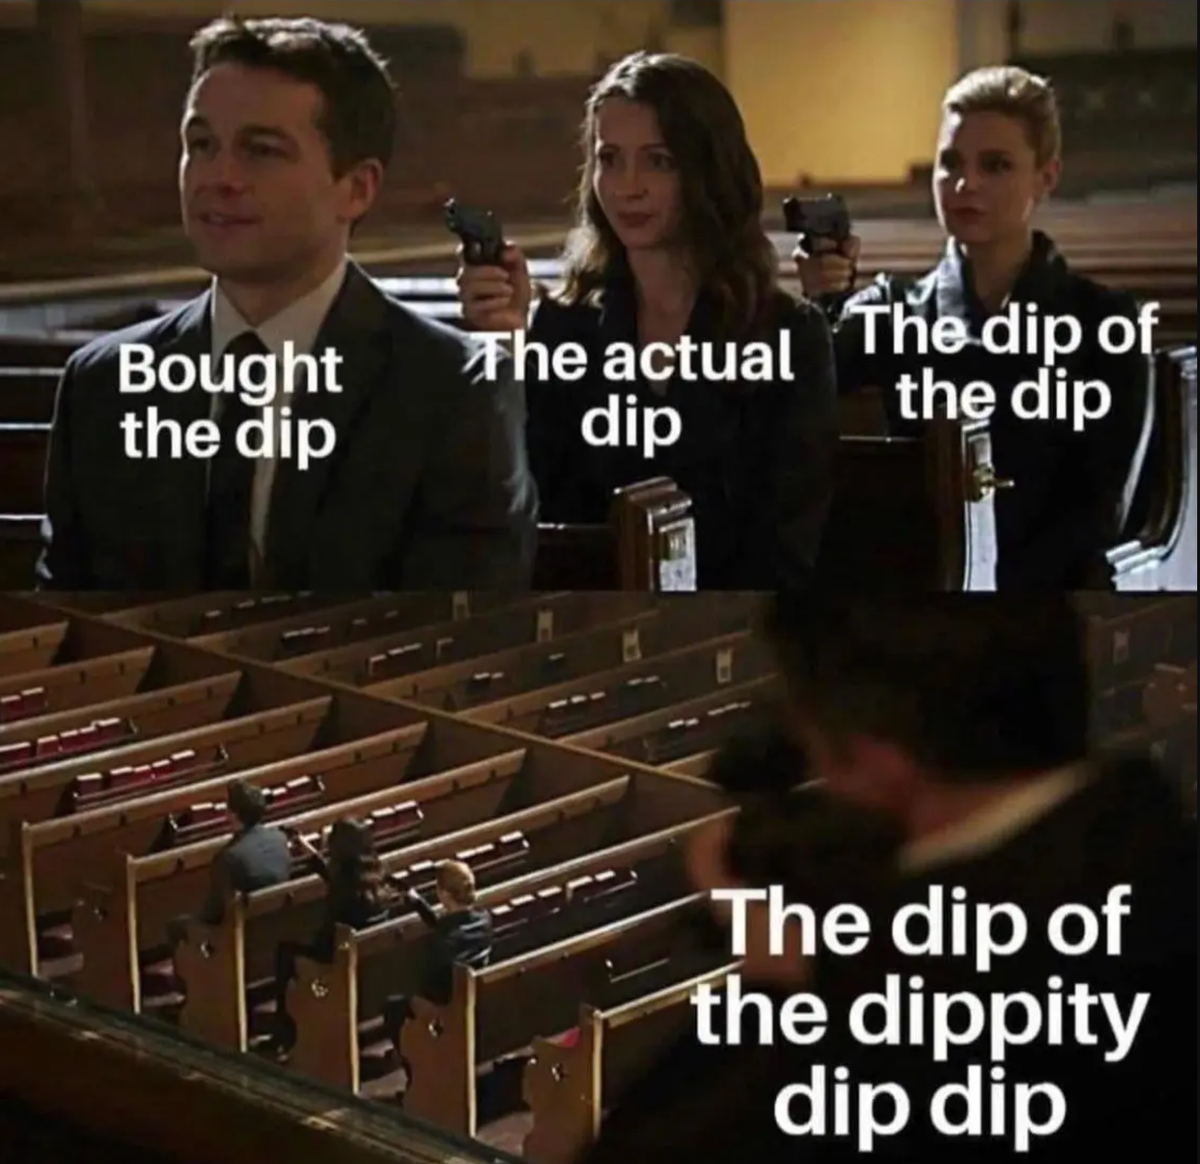
If you’re looking for more context on this subject, check out our previous articles: "The Dip of the Dippity Dip?" where we explored the pivotal point for bulls at 53k, and "Is It Time to Get Excited?" which we’ll reference in today’s post for updates on targets and potential scenarios.

Key Topics in Today’s Analysis
- Monthly Charts and Price Discovery - We’re updating the monthly charts as we near a potential expansion candle, signaling the initial move into price discovery. This will set the stage for our upcoming analysis.
- Weekly Analysis - Next, we'll dive into the weekly analysis to explain why this time feels different. Some insights were shared on Telegram, but we’ll expand on those ideas here for a clearer picture.
- Altcoin Market Cycle Analysis - Are we truly trending with Bitcoin, or is another bloodbath on the horizon? We’ll assess interesting plays based on macro reversal signals, setting the tone for our altcoin outlook.
Big Daddy Bitcoin
In our previous macro view, we identified hidden consolidation levels around 23k and 42k. After refining my technical analysis, we have two price targets aligned, with timeframes matching the monthly charts.
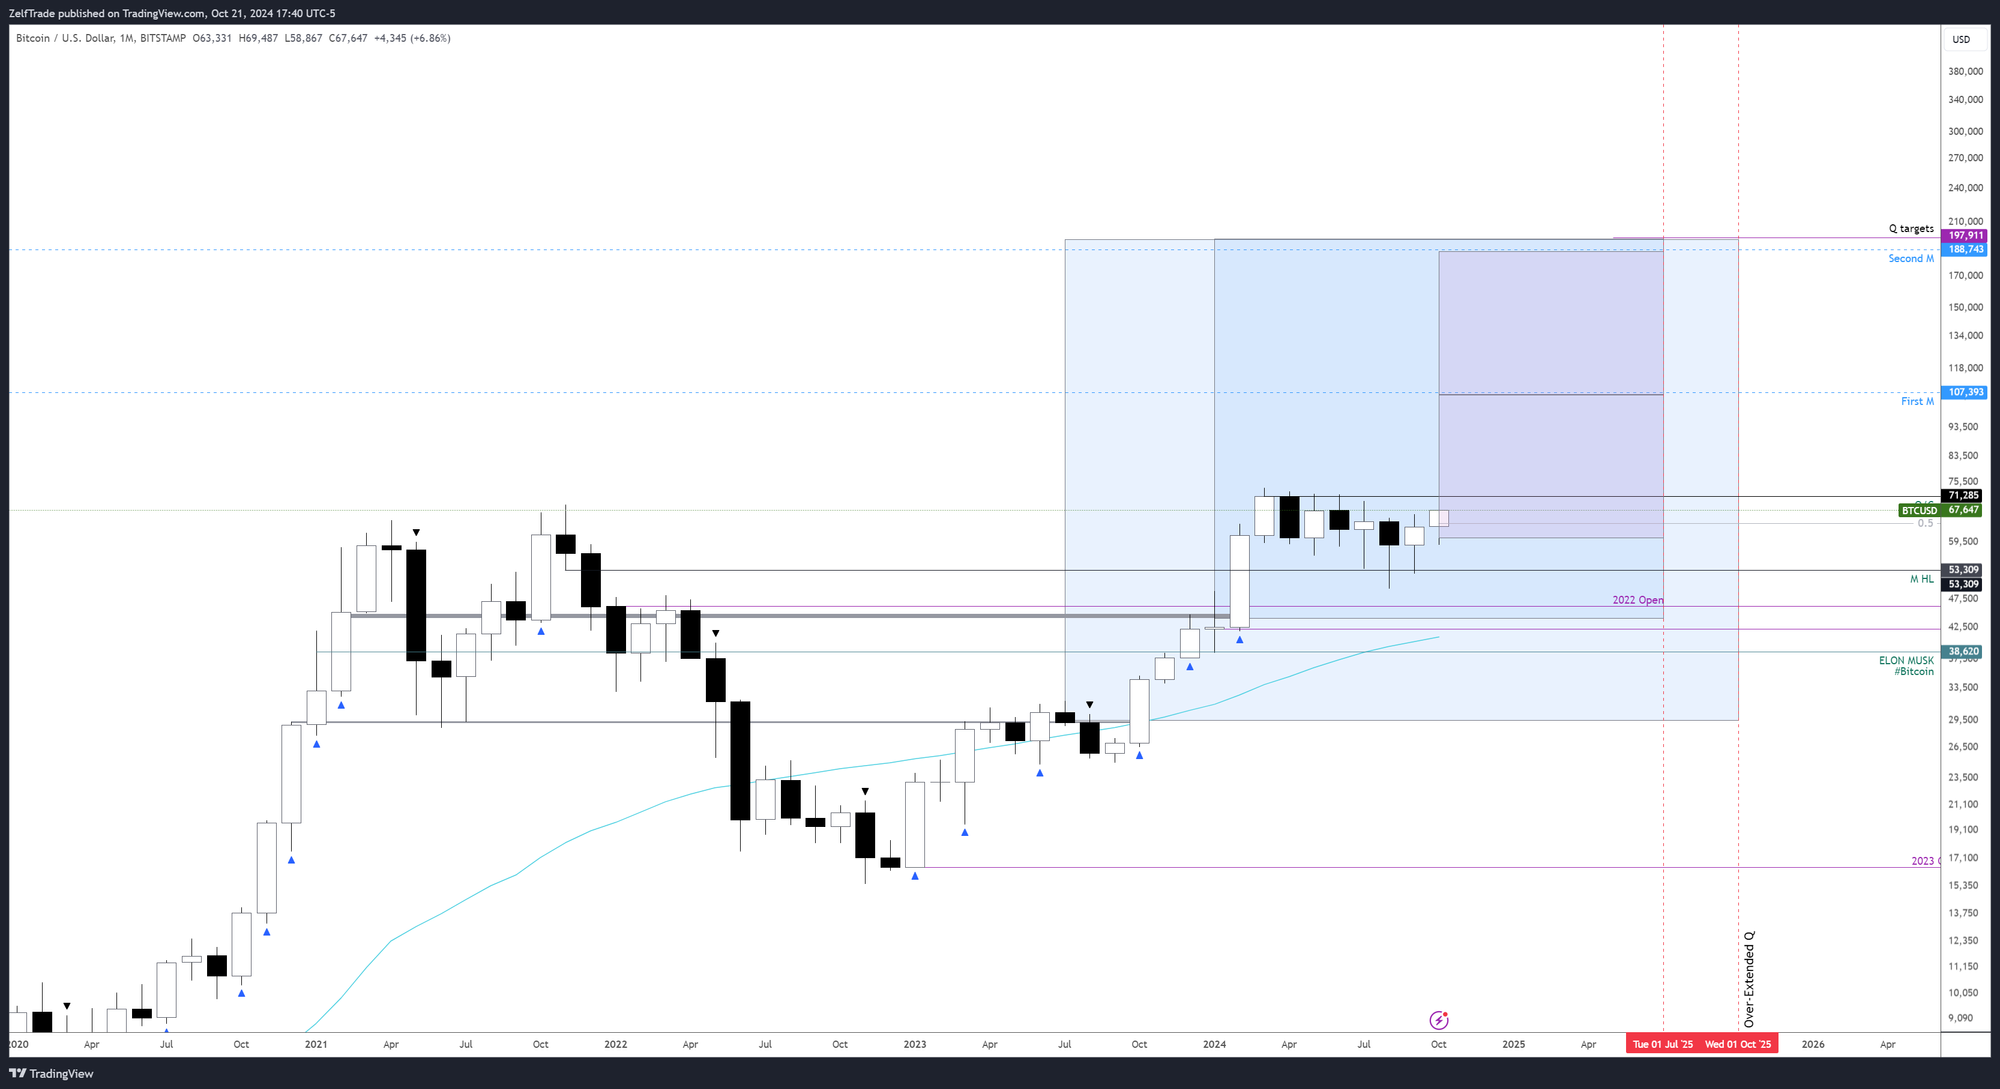
Currently, both bimonthly and quarterly trends point to $197k as a likely top for this last leg. It seems surreal, especially considering the nearly 50% price variance between both modes, yet the targets align remarkably well.
As for timing, one target aligns with the monthly chart, suggesting that July could be the top, which seems more reasonable than October's expiry. However, based on previous history and Bitcoin’s cycle fractals, October is typically when we see a peak. We’ll have to wait and see how far this “ponzi” will pump—whether it goes above 100k or drops back below 40k in a year.

Weekly Insights
This time is different, and here’s why: While I haven’t focused much on ETF flows, there’s clear evidence of dip buying below 55k. I highlighted this in "Bitcoin (BTC) - September's Crucial Test!" where I noted, "I remain cautiously bullish as long as Bitcoin holds above $54k," and it seems that was a solid dip-buying opportunity. I wouldn’t call it a generational buy just yet—2019 at 3.5k USD was a phenomenal entry point, after all, marking a 13x increase from current prices! Perhaps we could see something similar in the near future…

Now, back to the technical analysis.
The movement from the current low has been bullish. Unlike the bouncing rallies of April, July, and August, we’re seeing a genuine bullish structure. With two active weekly modes confirmed, we’re well-positioned for what’s next.
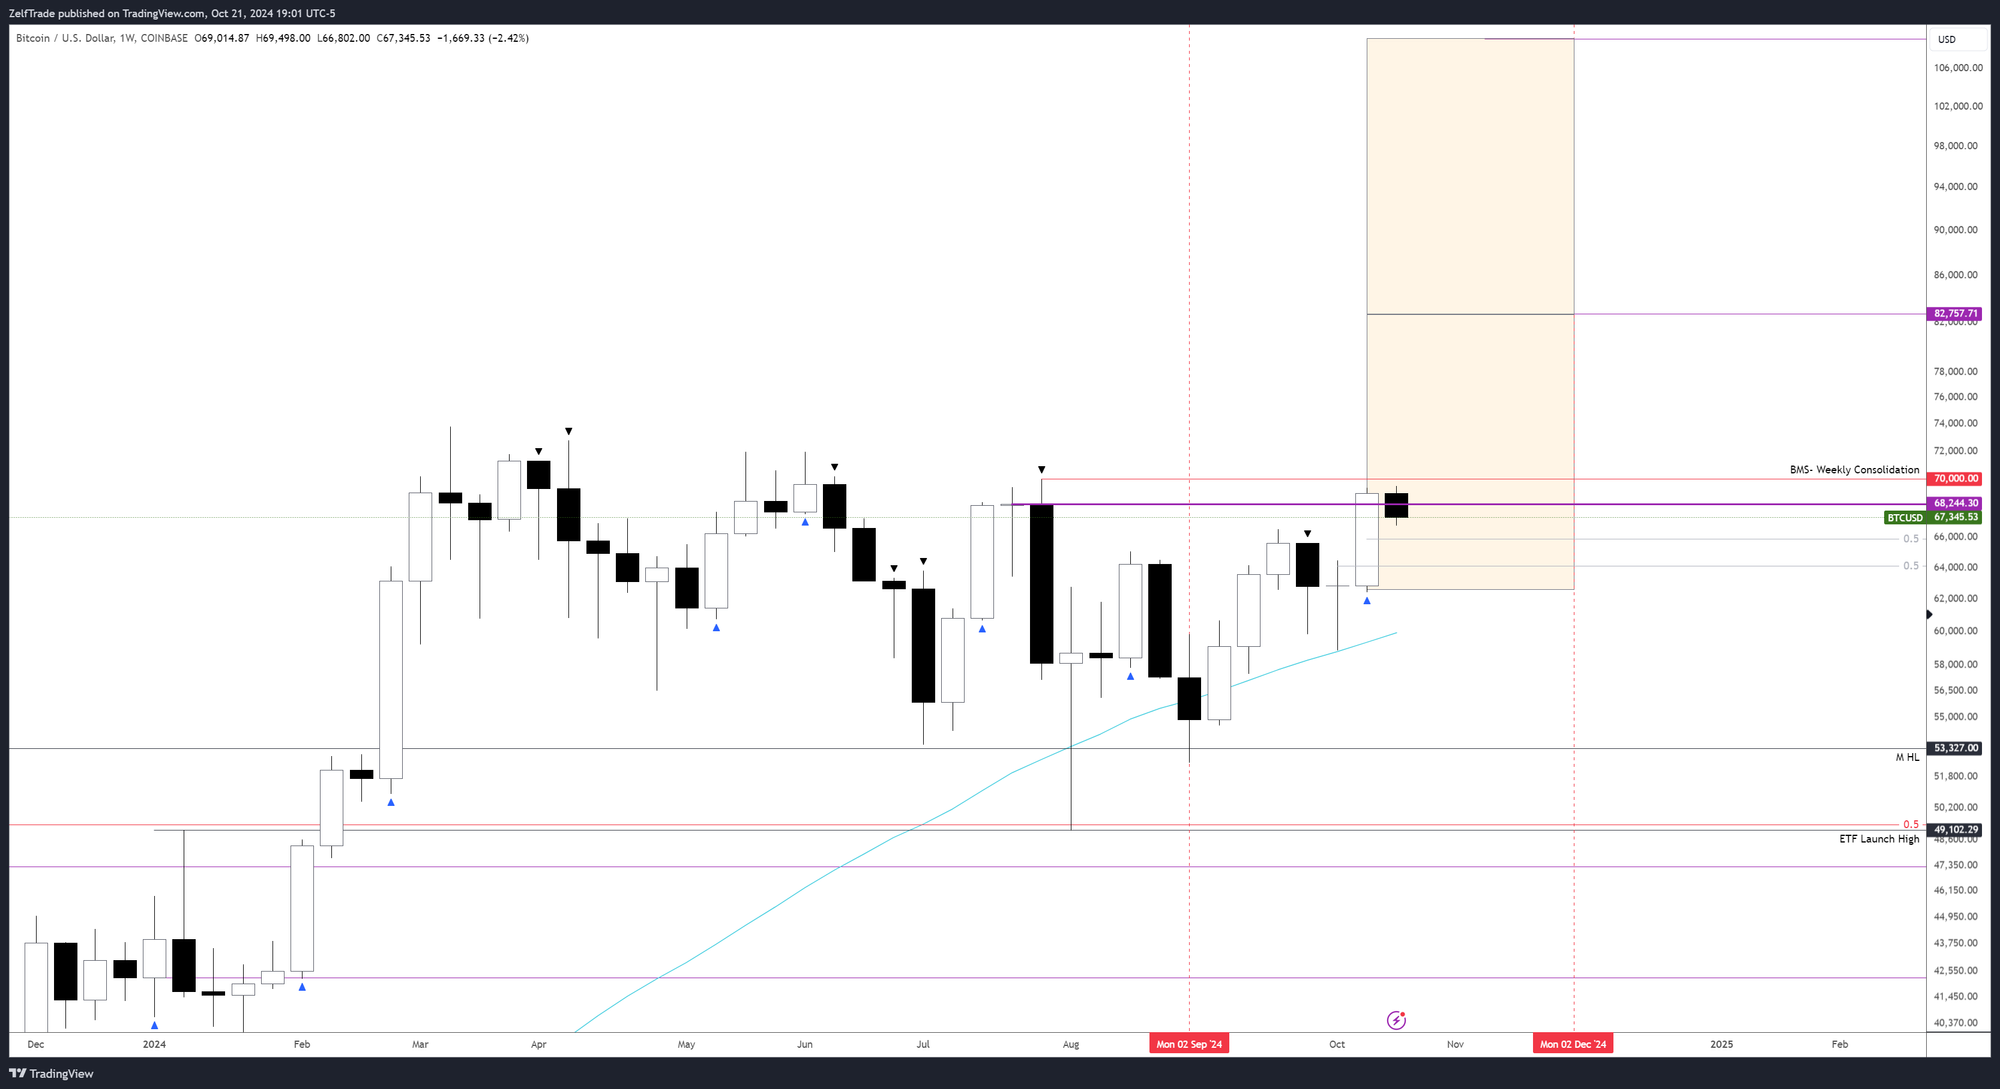
Despite closing above the swing high weekly block at ~68.3k, we have one last level to conquer. Breaking above 70k will eliminate bearish sentiment and send us into price discovery for real—no more 5% moves followed by lengthy consolidations.
Summary of Key Points
- Bearish sentiment still lingers as long as prices remain below 70k.
- Breaking 70k will force sidelined investors to buy back in.
- Weekly trend is strong, with new ATHs just within reach.
- Targets: 82k by December and potentially 110k if generous.
If we dip, I'm not betting on that scenario, but if it happens, look for bids around 66k and 64k.
P.S. Just think about it: why would the market offer another entry opportunity? Is it really going to provide another monthly retest for anyone who didn’t have the guts to get in earlier? The market has given enough chances; now it’s time to move on!
Altcoin Market Update
We’ve primarily seen on-chain plays in Solana as the sector to capitalize on, given that everything else is relatively stagnant. While we’ve had great movers like $MEW, $POPCAT, and $TURBO, the main narrative still revolves around memes and is likely to remain that way for now. However, we’re approaching a bullish flip into a trendy phase, and coins like $FTM, $NEAR, and $SUI could lead the charge.
The chart below (Altcoin Index) shows a reclaim of the 2024 Open, creating a technical setup after the price deviation below this level. If it moves above the Blue MA and starts printing blue candles, it will signify a trending environment, indicating that the market is returning to full risk-on mode. Conversely, if it drops below the 2024 Open, we’ll need to reevaluate the bullish narrative and recognize a clear invalidation of our current outlook.
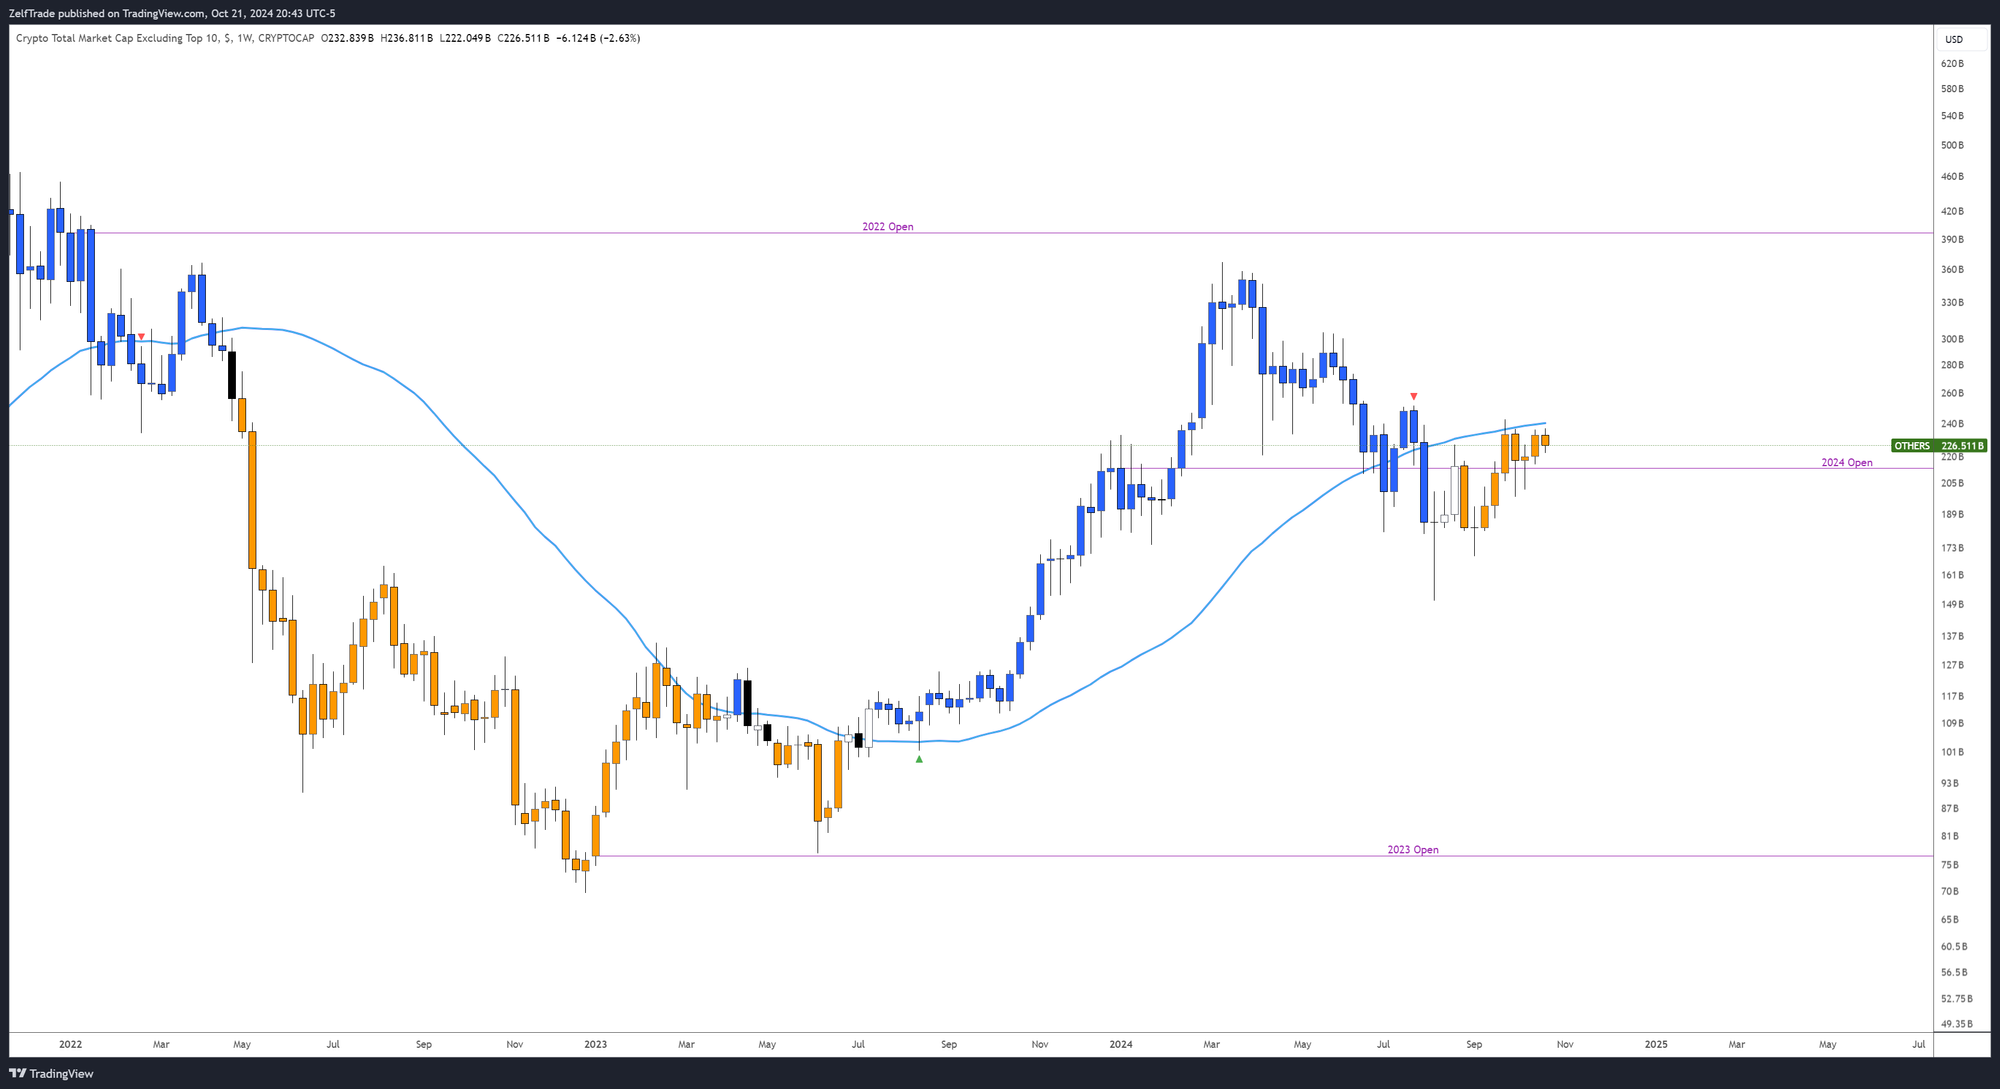
The second chart displays the reclaim level in terms of billions necessary to initiate a trending movement.
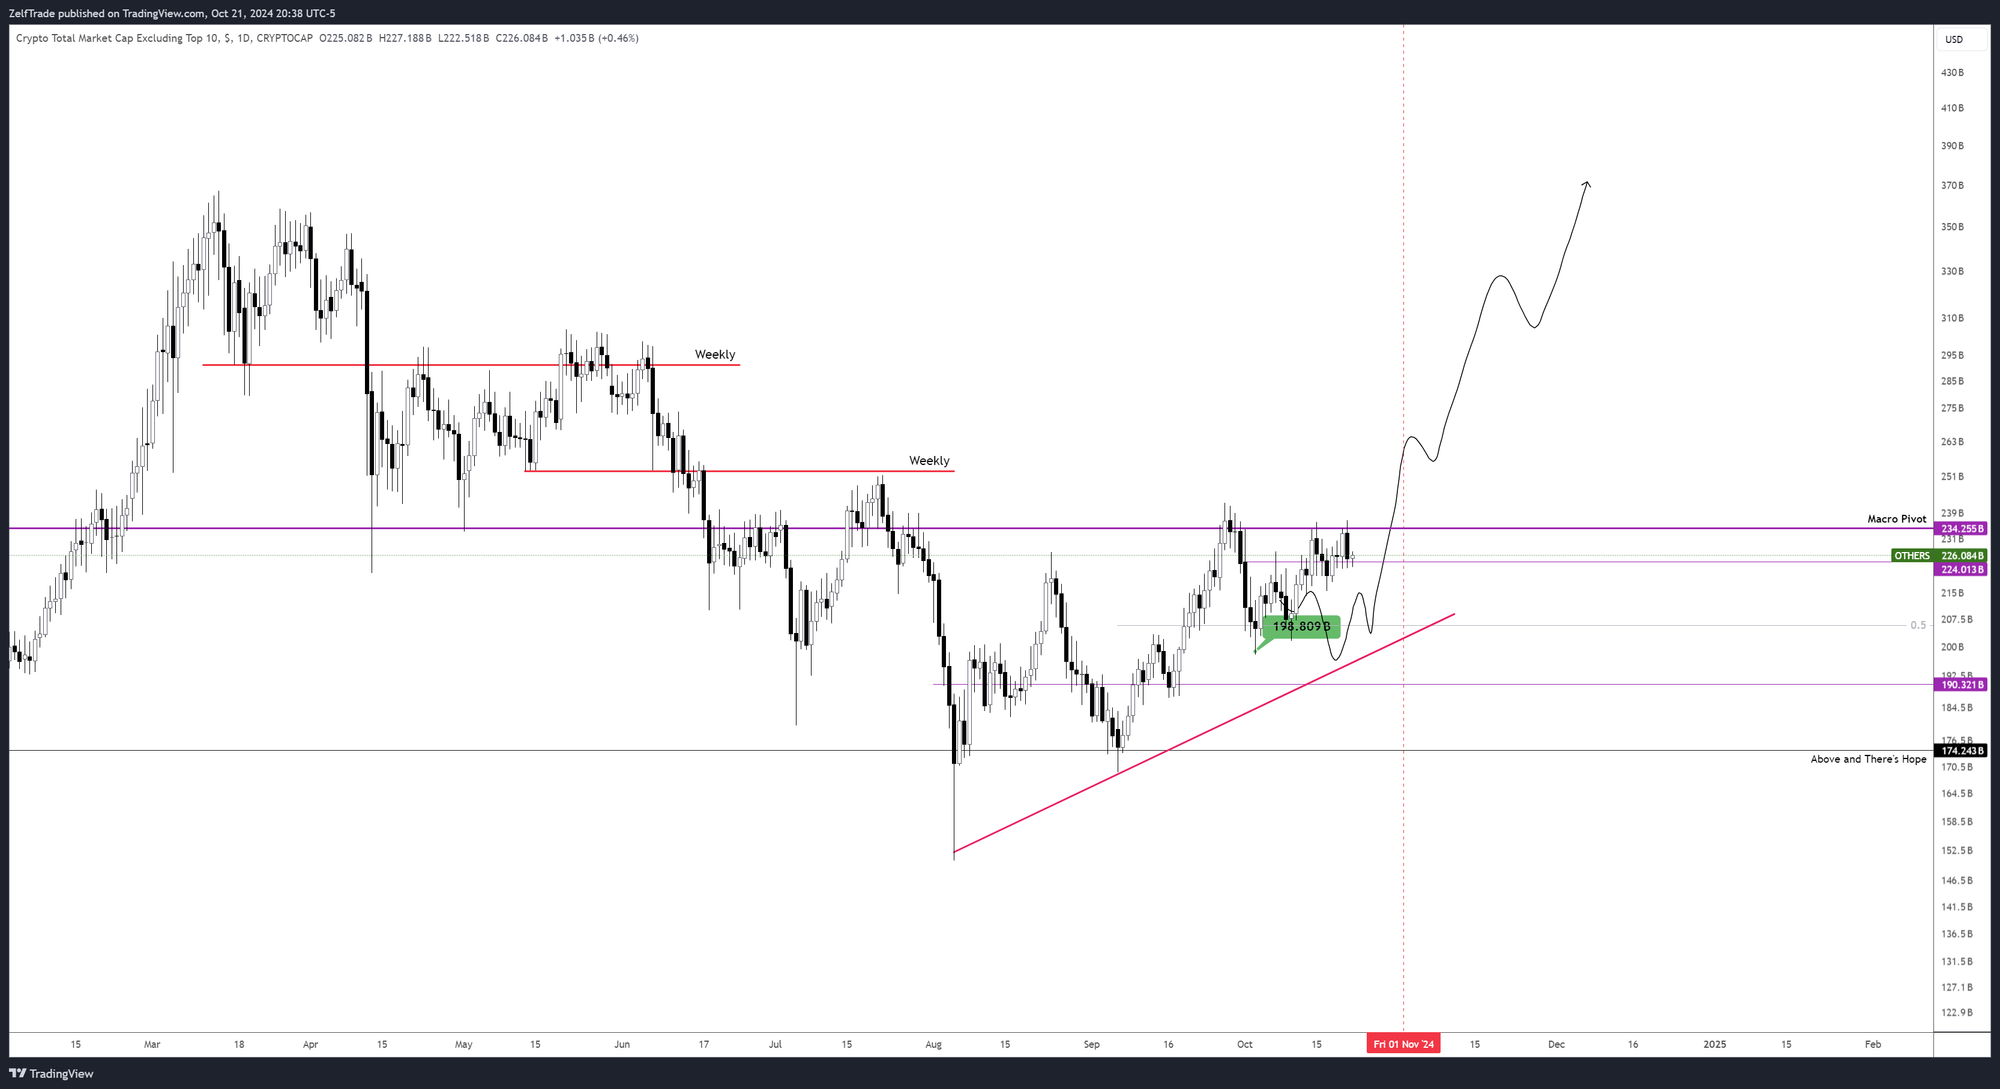
As you can see, both charts have yet to flip bullish, while Bitcoin has remained strong throughout this cycle. This is the main reason I expect many altcoins to continue losing ground against Bitcoin. Moreover, the meme frenzy on-chain has captured most retail attention, with even Forbes discussing AI-generated coins released on Solana’s chain.
The key to picking the right winners is to concentrate on strong macro signals to accumulate sats against BTC or to risk a small percentage of your portfolio on promising on-chain plays.
Chart Comparison:
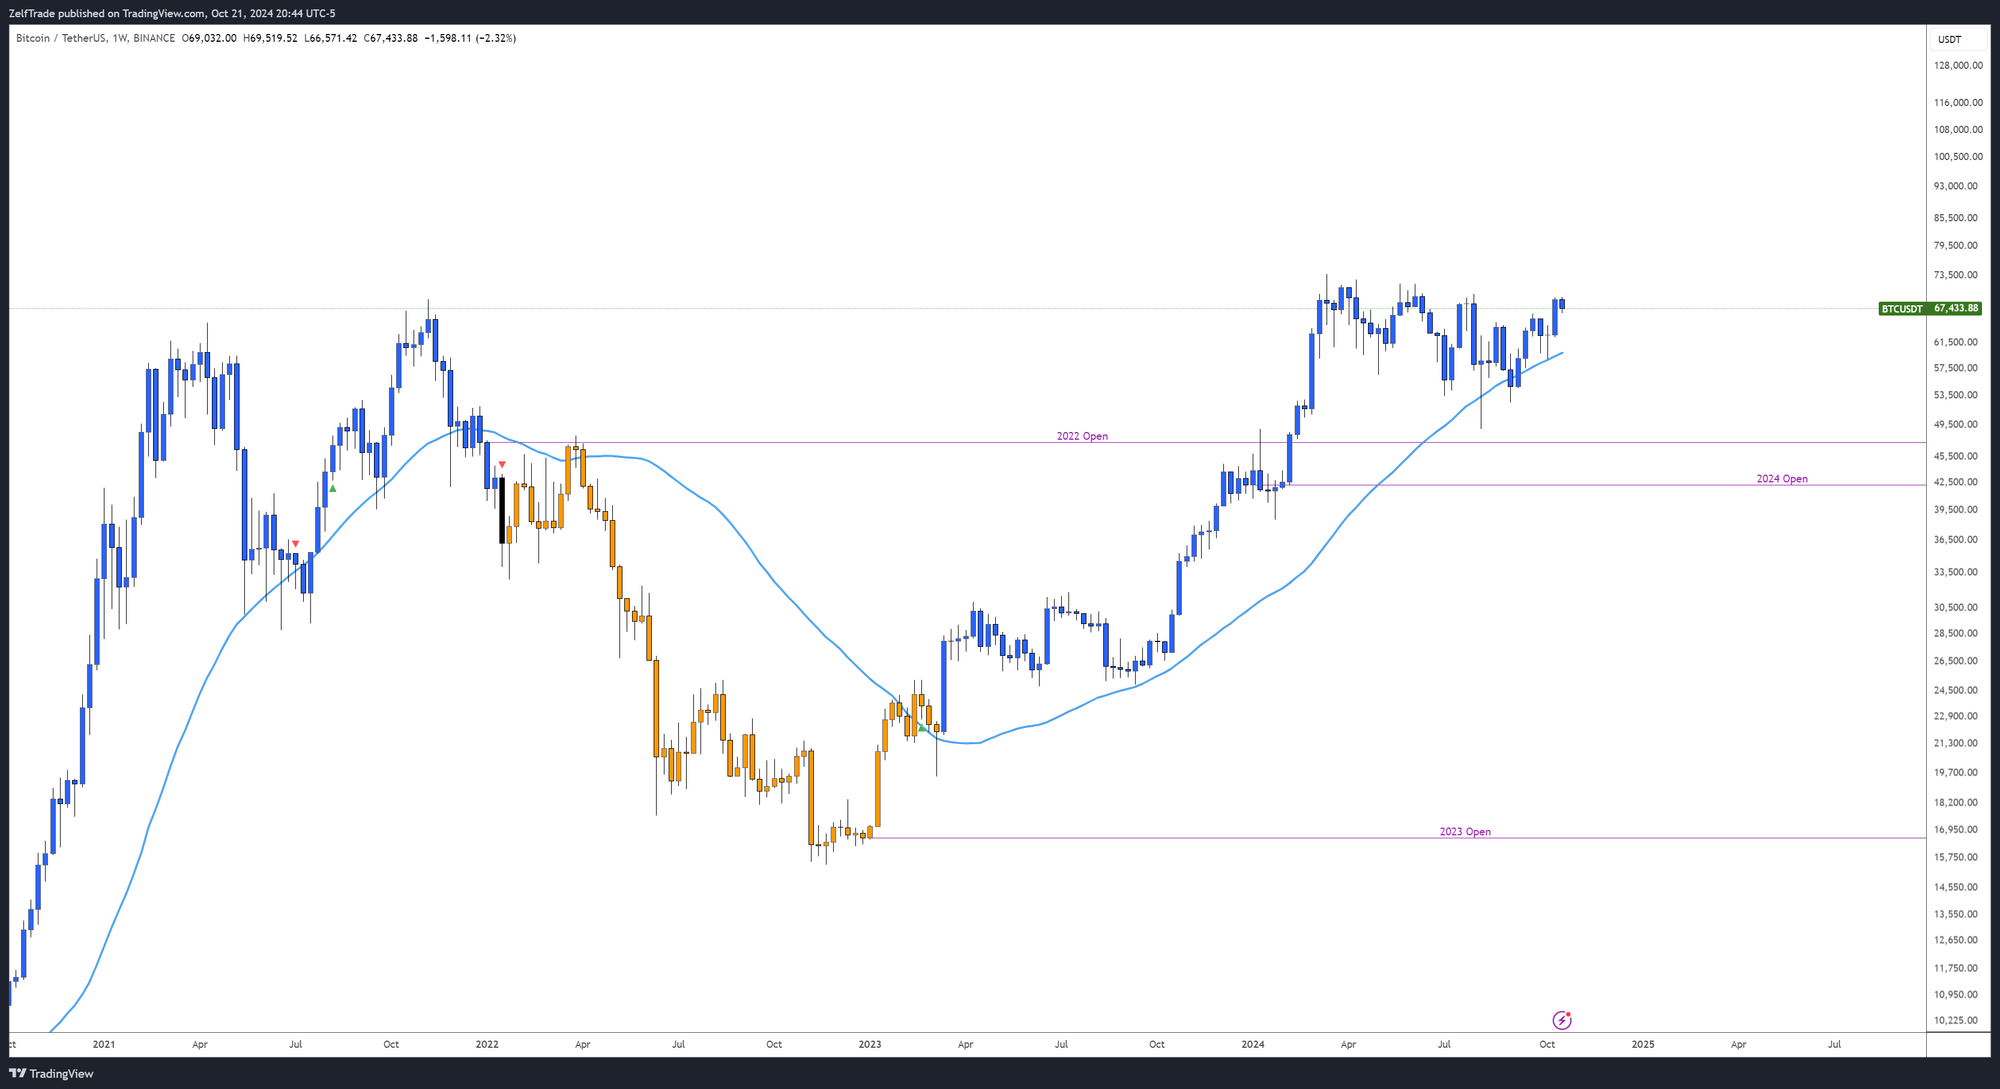
BTC: We are clearly in a trending environment. The last nine months have seen a range, providing ample opportunities for both bulls and bears. This tool will serve as confluence once the market has topped. Notably, you can see how it flipped bearish back in March 2022.
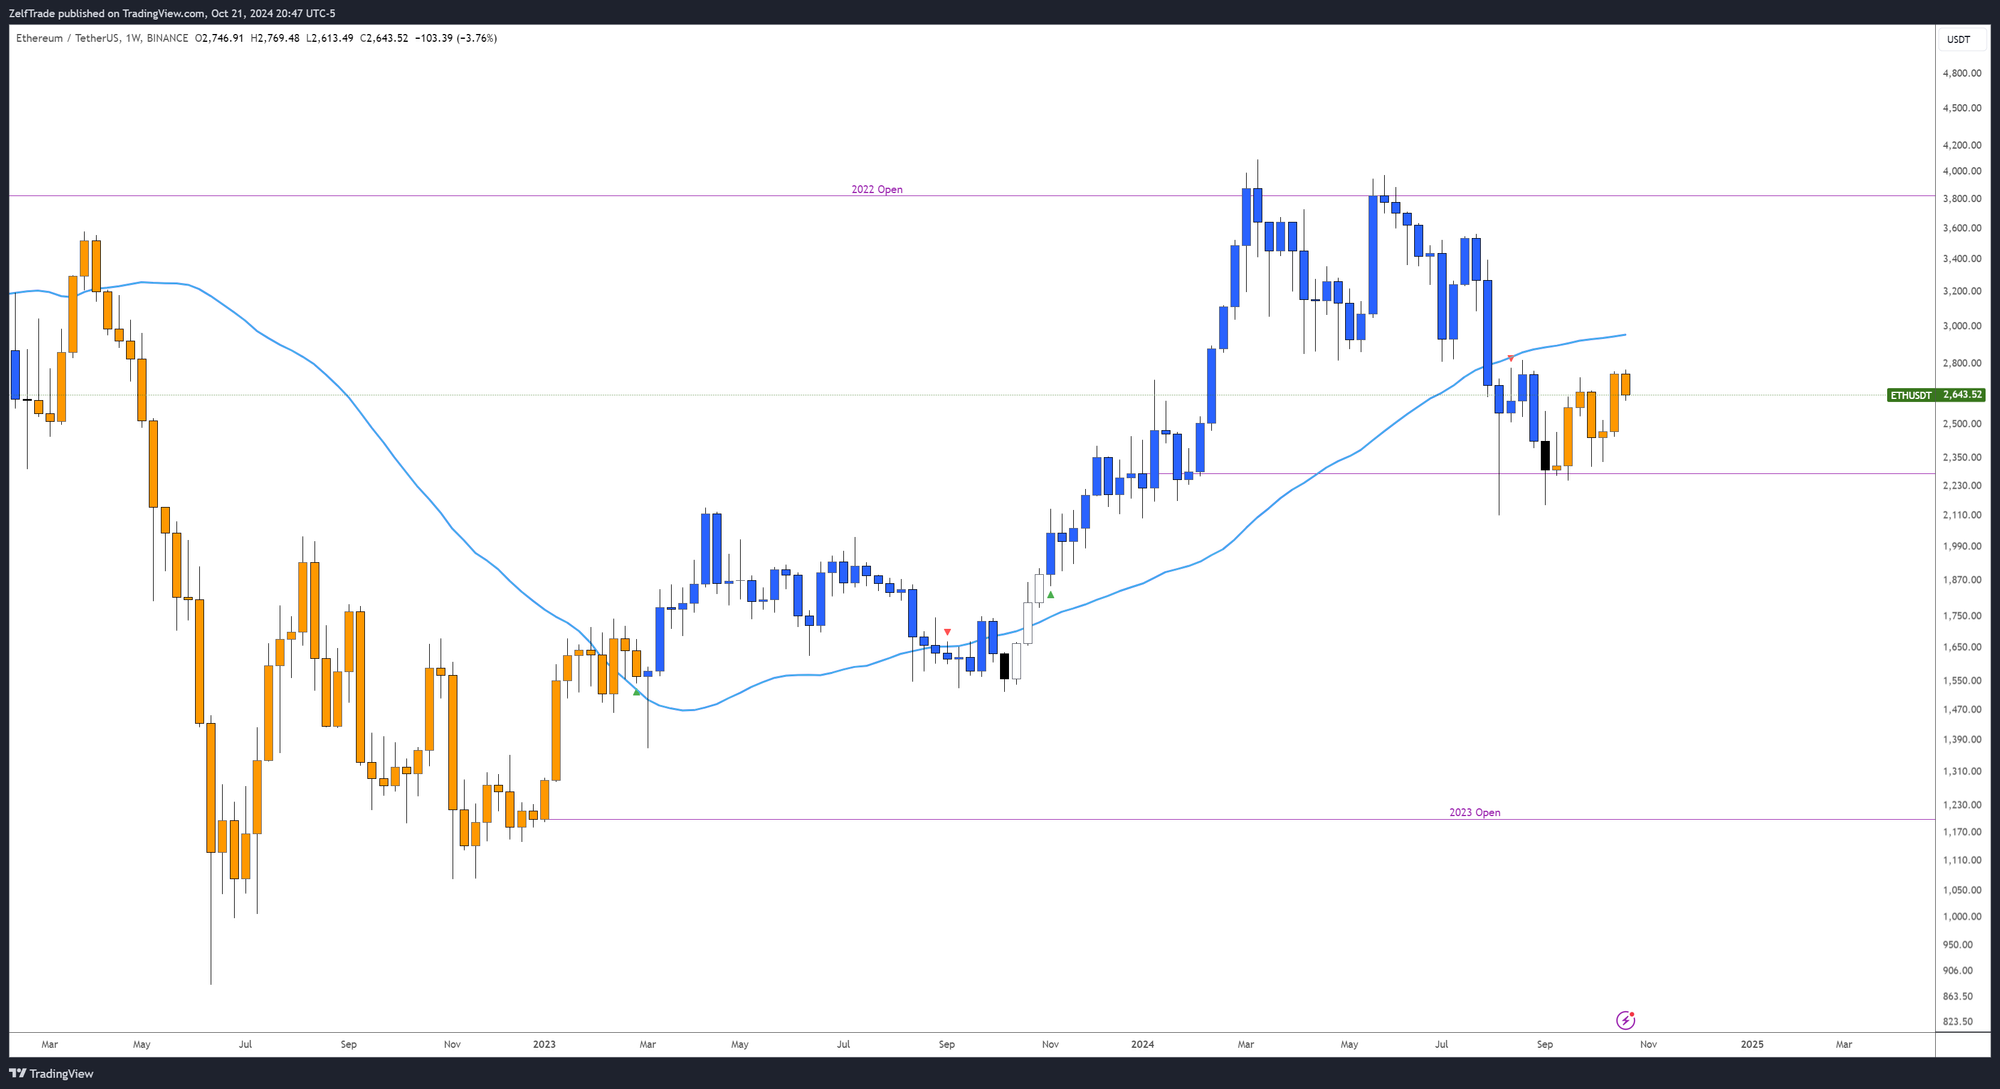
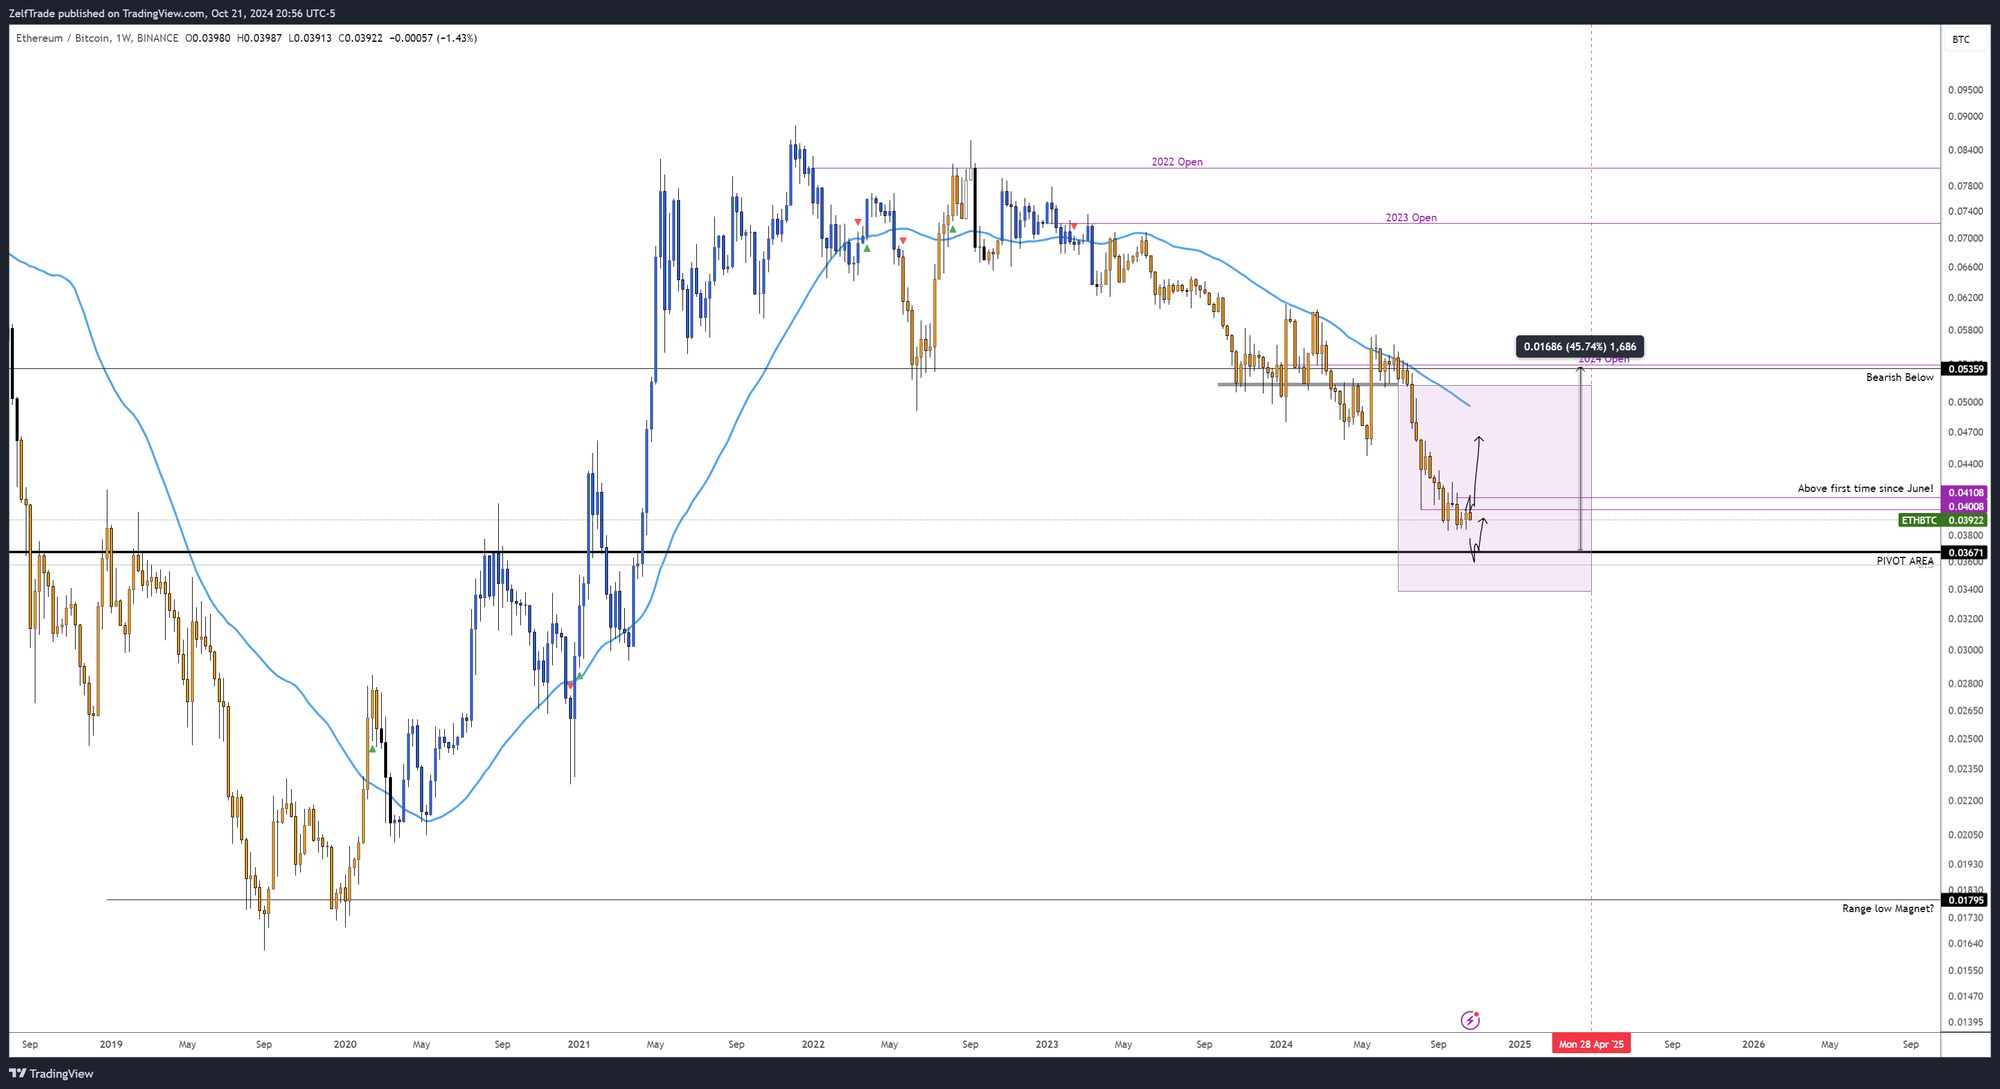
ETH : Are you surprised? The outlook isn’t overly optimistic. While there are targets suggesting a move above $10k once confirmed, Ethereum has clearly lagged in this cycle. The monthly chart remains bearish against $BTC, with this signal active until April. Even if ETH trends higher alongside Bitcoin, it’s unlikely to gain significant ground.
The silver lining is its retest of a macro pivot at 0.036, which presents a solid opportunity to position for a potential move in Ethereum. Beyond that, the momentum seems lackluster—here's hoping the bearish monthly signal reverses!
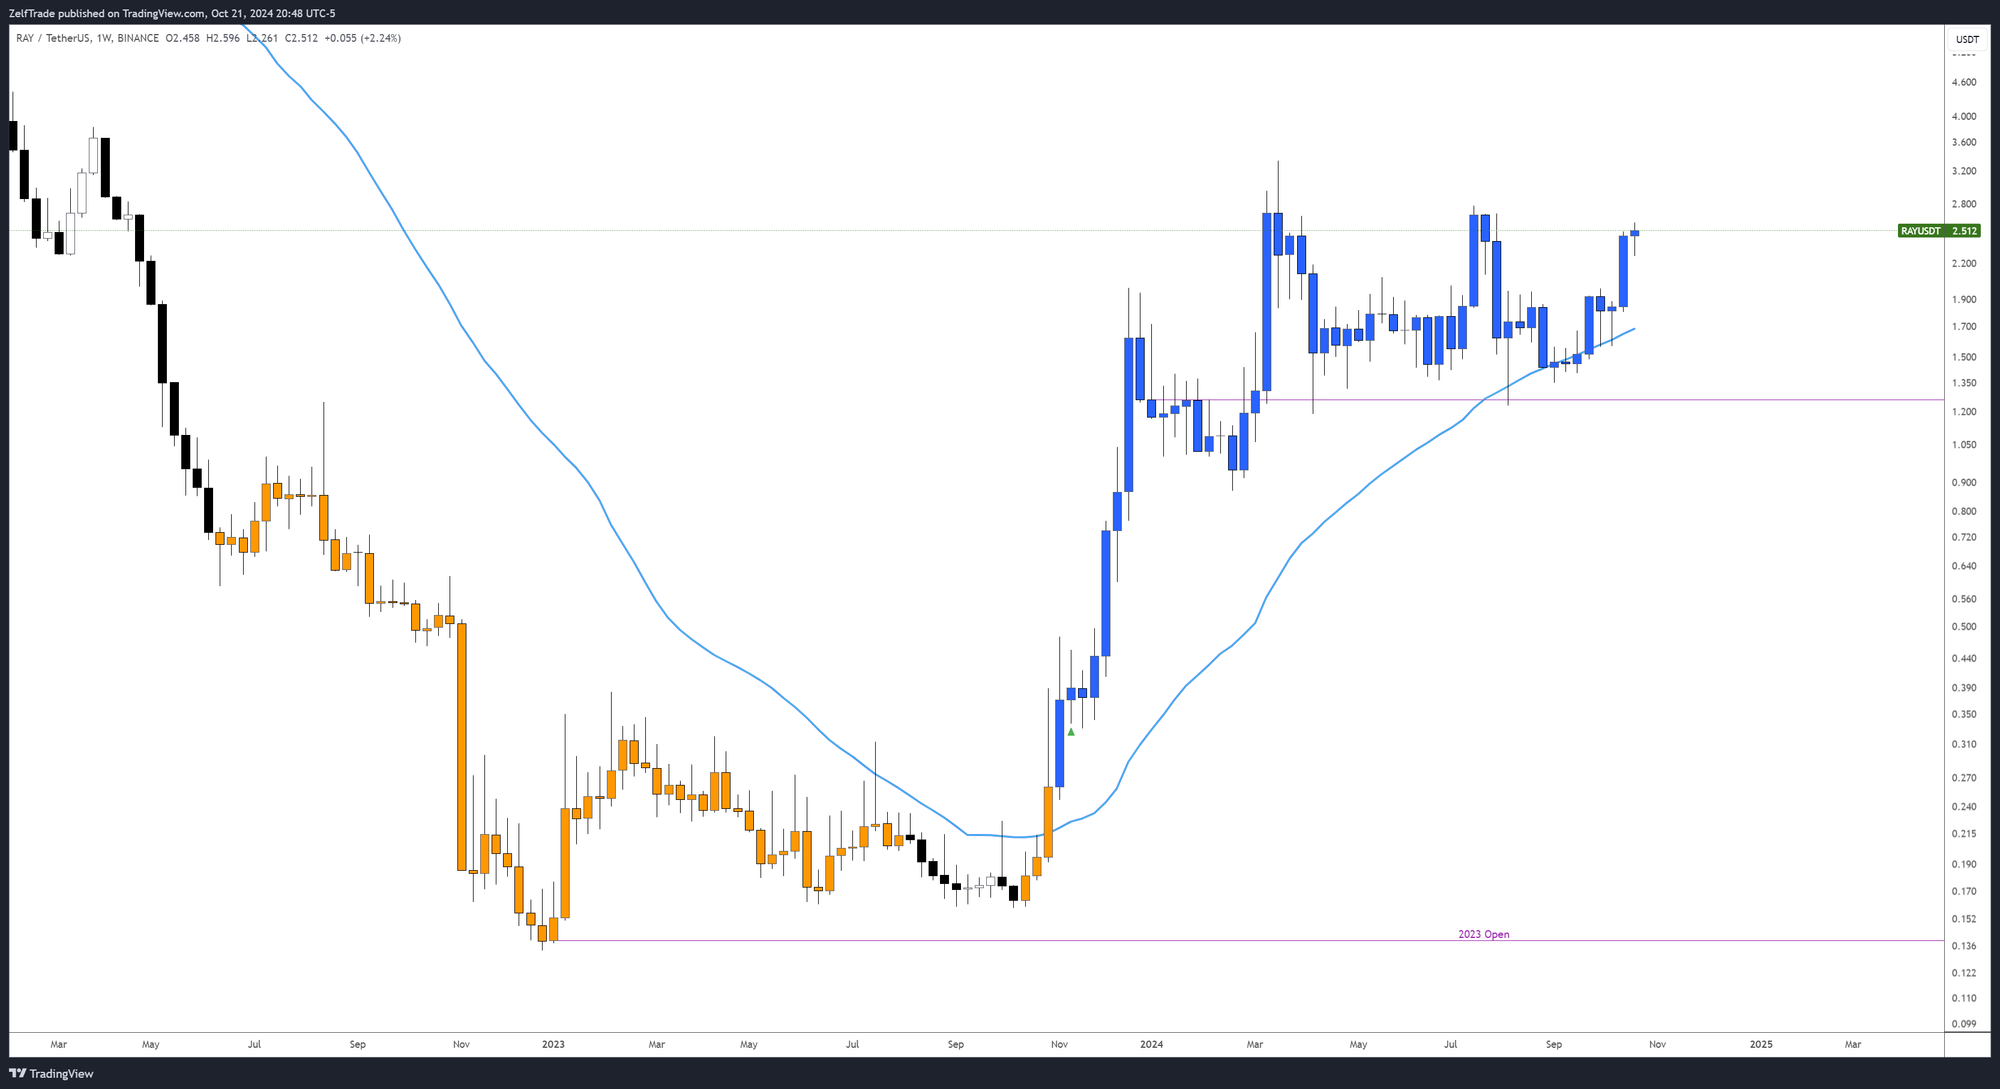
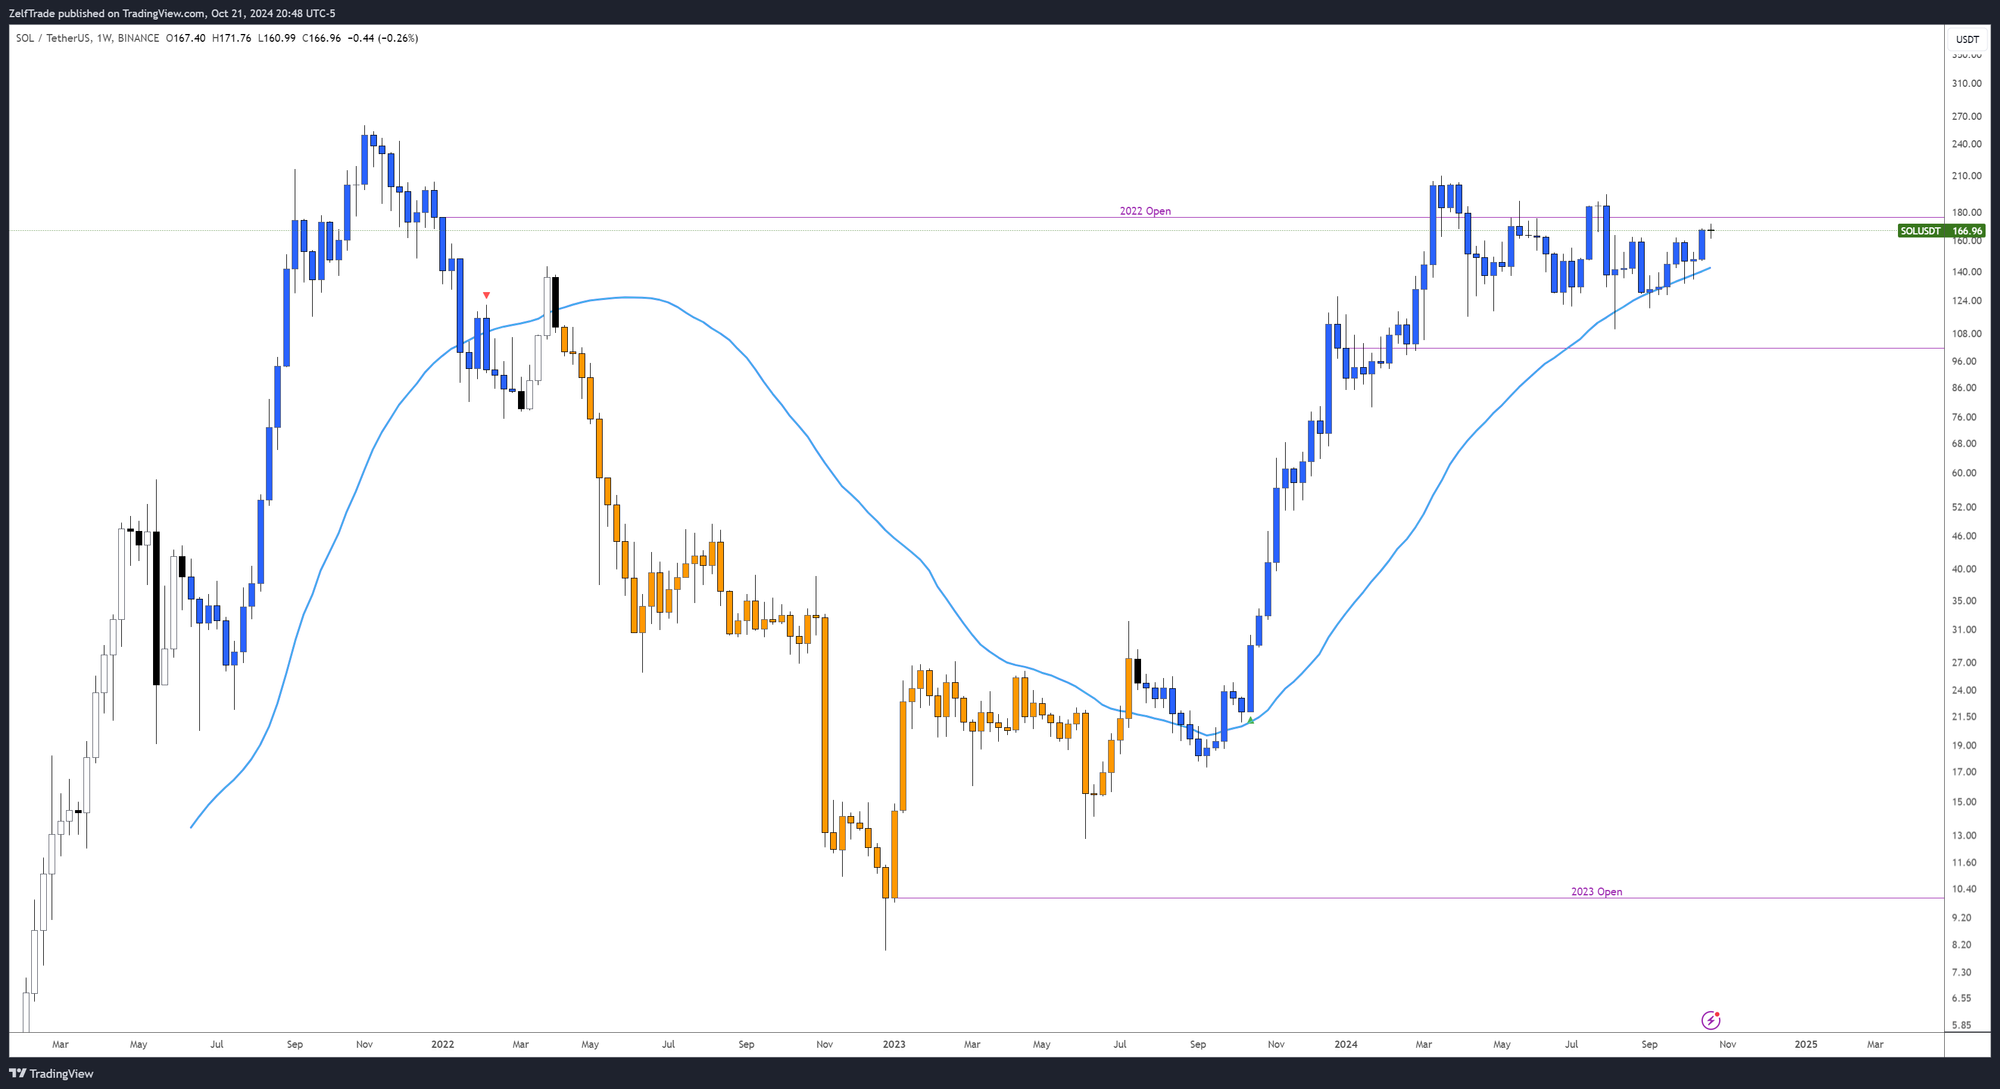
RAY and SOL: The difference is noticeable here. Focus on strong performers and first movers. There's little point in exploring other sectors unless the narrative shifts significantly. Both RAY and SOL display the cleanest weekly charts using this indicator.

This is the trade from TradingView in case anyone missed it.
Final Thoughts
Everything is aligning, folks. The rotational phase is nearing its end. October has turned out to be anything but flat, and we’re on the verge of breaking above 70k. Should we add our last spare cash here? No, always keep fresh stables handy for the best dip-buying opportunities.
If Trump wins, expect stronger movements. If Kamala wins, brace for an initial retrace followed by choppy waters and controlled moves, especially in crypto. It’s not the market I want to navigate, but preparation is key in case that scenario unfolds.


